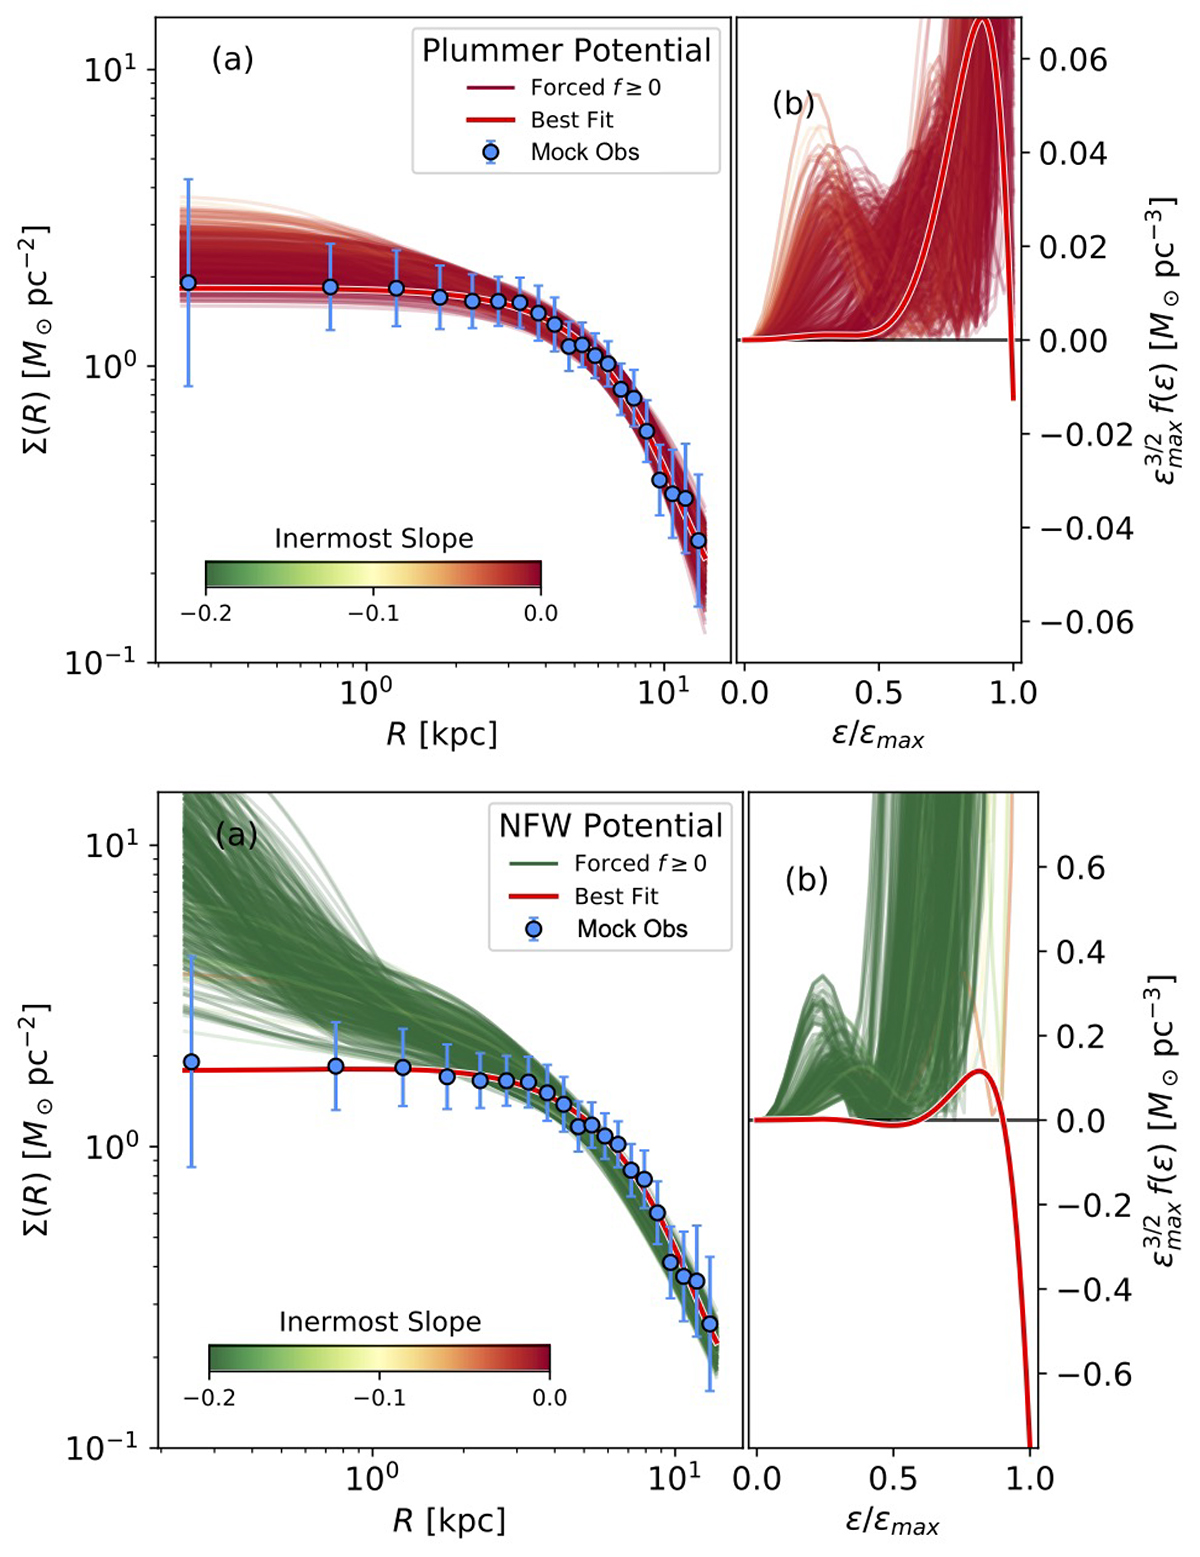
Fig. E.4.
Download original image
Mock profiles using all the data from Nube but rearranging the inner points so that the resulting profile decreases monotonically outward (the symbols labeled as Mock Obs). This re-arrangement is consistent with the error bar of the observation but clears out the problem of the algorithm we employ to explain positive inner slopes. Top panels: case of a Schuster-Plummer potential. Bottom panels: case of a NFW potential. This figure is similar to Figs. E.5, with an identical color code.
Current usage metrics show cumulative count of Article Views (full-text article views including HTML views, PDF and ePub downloads, according to the available data) and Abstracts Views on Vision4Press platform.
Data correspond to usage on the plateform after 2015. The current usage metrics is available 48-96 hours after online publication and is updated daily on week days.
Initial download of the metrics may take a while.