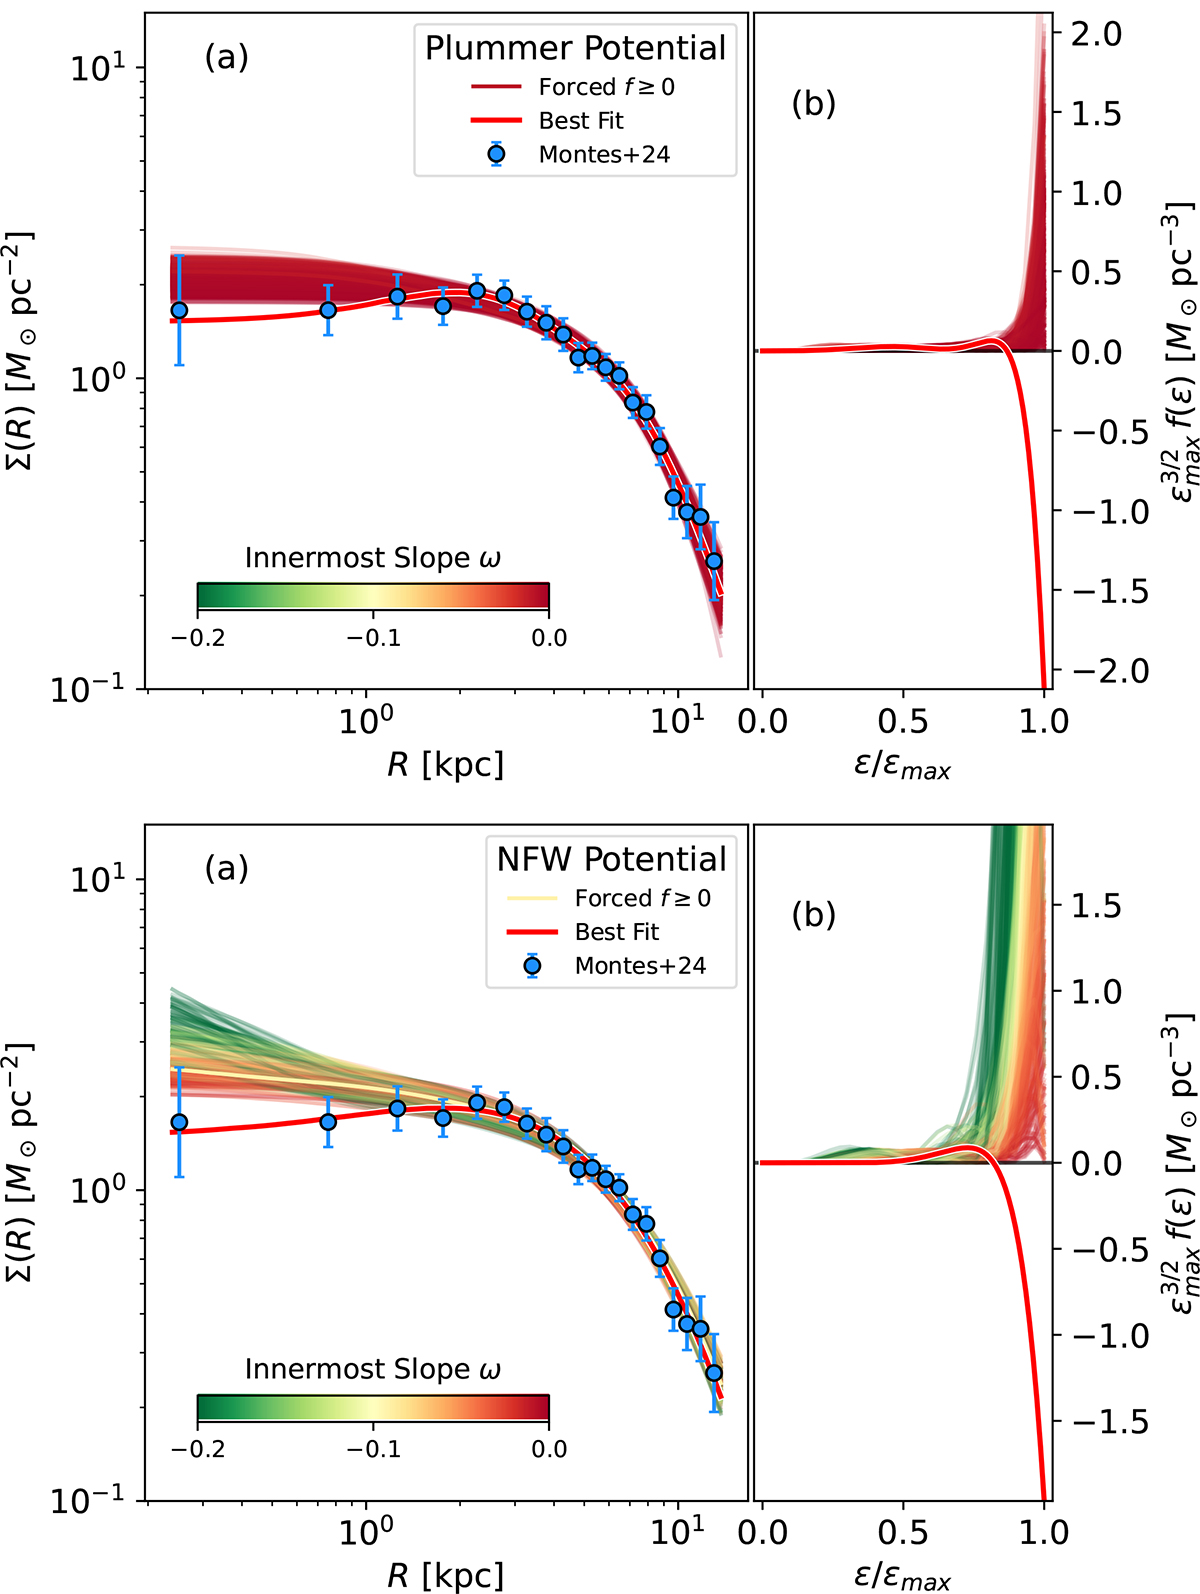
Fig. E.2.
Download original image
Similar to the fits corresponding to Figs. 6 and 7 but with smaller error bars that consider only photometric errors and errors in the mass-to-light ratio calibration. The fits assuming a Schuster-Plummer potential are shown in the top panels whereas those assuming a NFW potential are in the bottom panels. The result discussed in the main text remains. Compared with the NFW fits, the Schuster-Plummer potential fits with f(ϵ) > 0 (colored lines) have both an inner slope closer to the observed one and a smaller χ2. The color code is the same in the two panels and also the same of the code used in the figures of the main text. For further details, see the caption of Fig. 6.
Current usage metrics show cumulative count of Article Views (full-text article views including HTML views, PDF and ePub downloads, according to the available data) and Abstracts Views on Vision4Press platform.
Data correspond to usage on the plateform after 2015. The current usage metrics is available 48-96 hours after online publication and is updated daily on week days.
Initial download of the metrics may take a while.