Fig. E.1.
Download original image
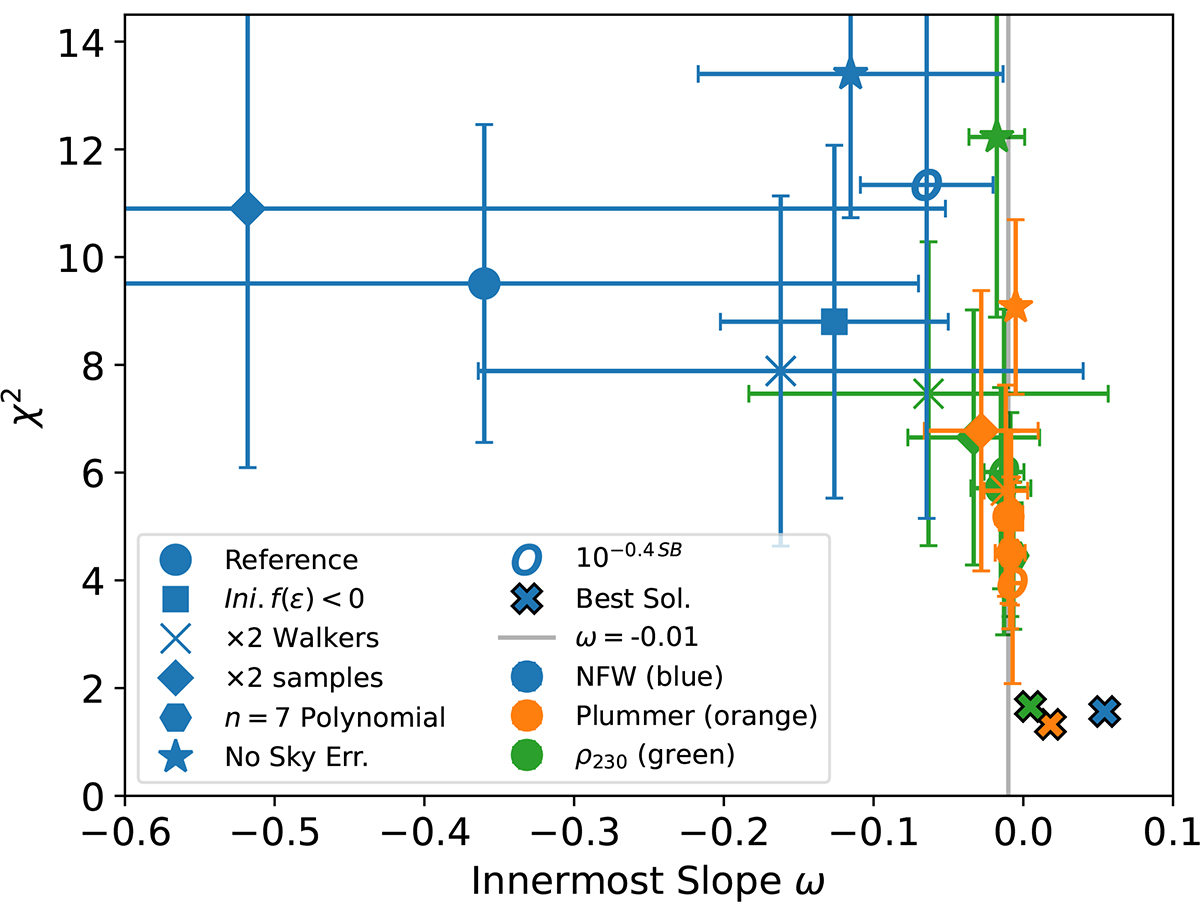
Scatter plot summarizing how changing the hyper-parameters of the fit affect the interpretation of Nube’s surface density profile. The symbols with error bars represent the mean and the standard deviation of χ2 and ω inferred from the different posteriors. Each color corresponds to a different potential, with blue, orange, and green symbols representing NFW, Schuster-Plummer, and ρ230 potentials, respectively. Each type of symbol corresponds to a different set of hyper-parameters as indicated in the inset (see Appendixes E.1 and E.2 for details). The values for the nominal hyper-parameters used in the main text are portrayed as bullet symbols and denoted as “Reference” in the inset. The figure also includes the χ2 and ω from the best fits obtained with unconstrained f(ϵ), which are the same as the thick times symbols shown in Fig. 8. The vertical gray line is the same as that in Fig. 8.
Current usage metrics show cumulative count of Article Views (full-text article views including HTML views, PDF and ePub downloads, according to the available data) and Abstracts Views on Vision4Press platform.
Data correspond to usage on the plateform after 2015. The current usage metrics is available 48-96 hours after online publication and is updated daily on week days.
Initial download of the metrics may take a while.