Fig. A.1.
Download original image
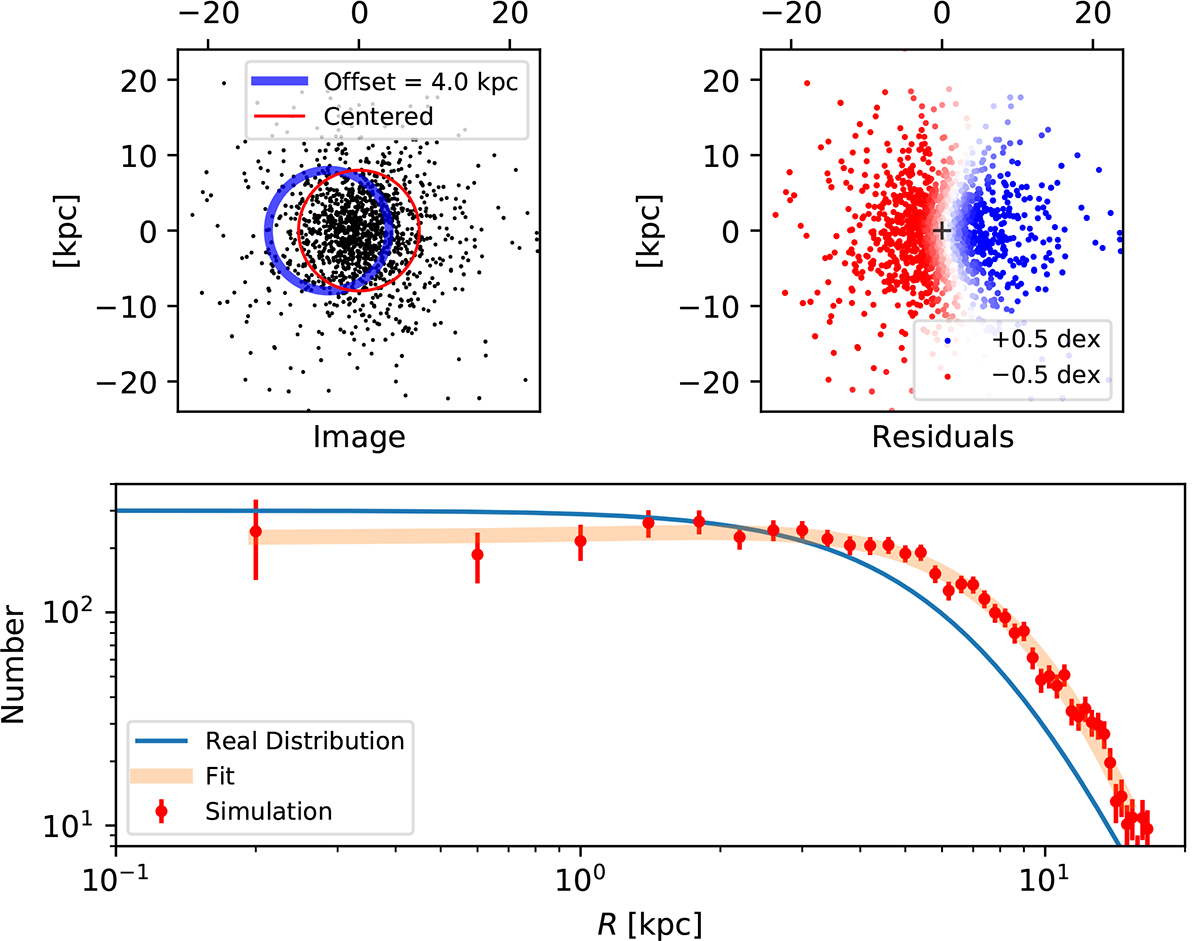
MC simulation to show the effect of using a wrong center to compute the stellar mass surface density radial profile of a galaxy. Top left panel: the dots represent individual stars. It shows only 103 of them to avoid overcrowding but the actual simulation has 104. The red circle is centered in the true distribution whereas the blue circle is offset by 4 kpc. Top right panel: same as the left panel color coded with the residual left when subtracting a radial profile computed with the 4 kpc offset (the thick orange line in the bottom panel). Bottom panel: surface density profiles (the symbols with error bars) computed using ∼50 rings offset from the true center as indicated in the top left panel. The error bars give the Poisson noise arising when counting stars. The true centered distribution is shown in blue.
Current usage metrics show cumulative count of Article Views (full-text article views including HTML views, PDF and ePub downloads, according to the available data) and Abstracts Views on Vision4Press platform.
Data correspond to usage on the plateform after 2015. The current usage metrics is available 48-96 hours after online publication and is updated daily on week days.
Initial download of the metrics may take a while.