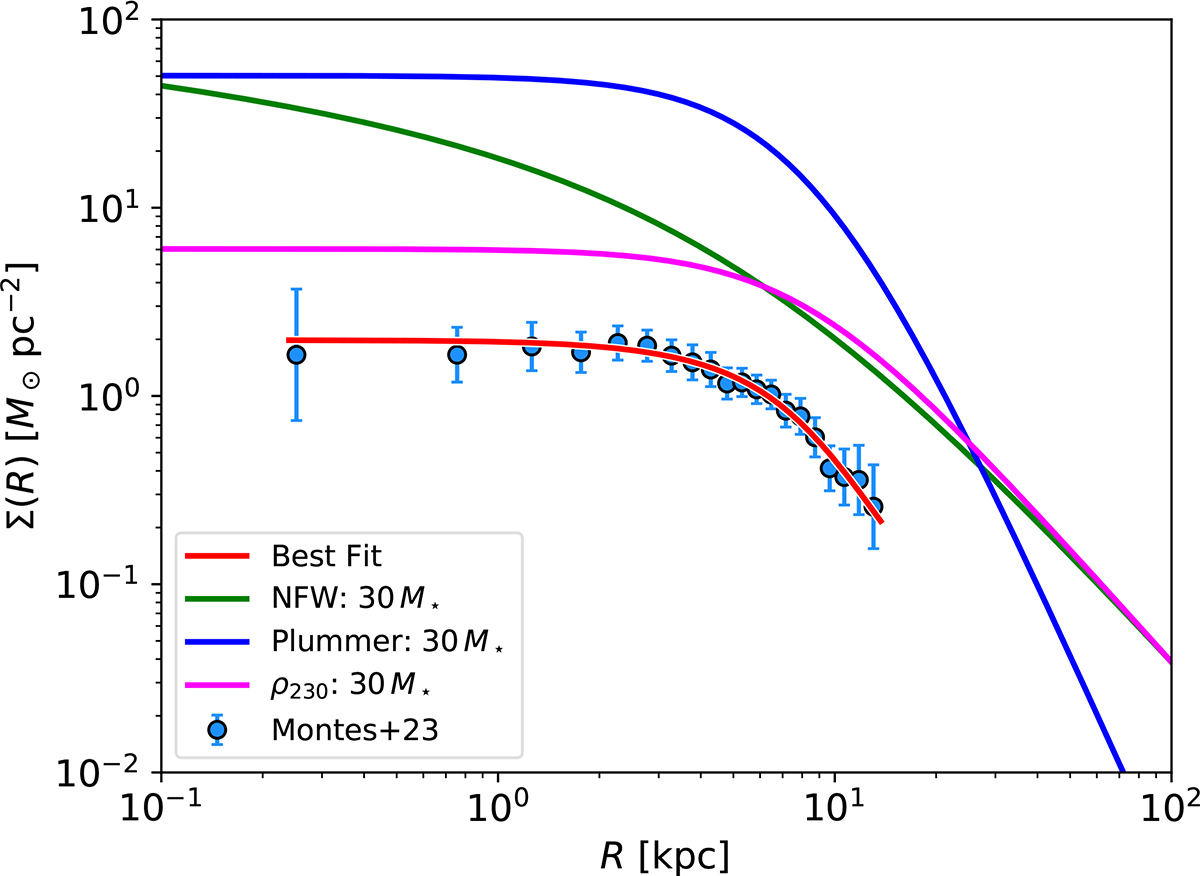
Fig. 10.
Download original image
Comparison between the stellar surface density profile of Nube and the best-fitting potentials with f ≥ 0. The plot shows the mass surface density that gives rise to the best-fitting Schuster-Plummer potential (blue line), NFW potential (green line), and ρ230 potential (magenta line). The spatial scaling of the potentials is set by the fit whereas the vertical scaling is arbitrary, and it was arbitrarily chosen to be 30 times the stellar mass of Nube.
Current usage metrics show cumulative count of Article Views (full-text article views including HTML views, PDF and ePub downloads, according to the available data) and Abstracts Views on Vision4Press platform.
Data correspond to usage on the plateform after 2015. The current usage metrics is available 48-96 hours after online publication and is updated daily on week days.
Initial download of the metrics may take a while.