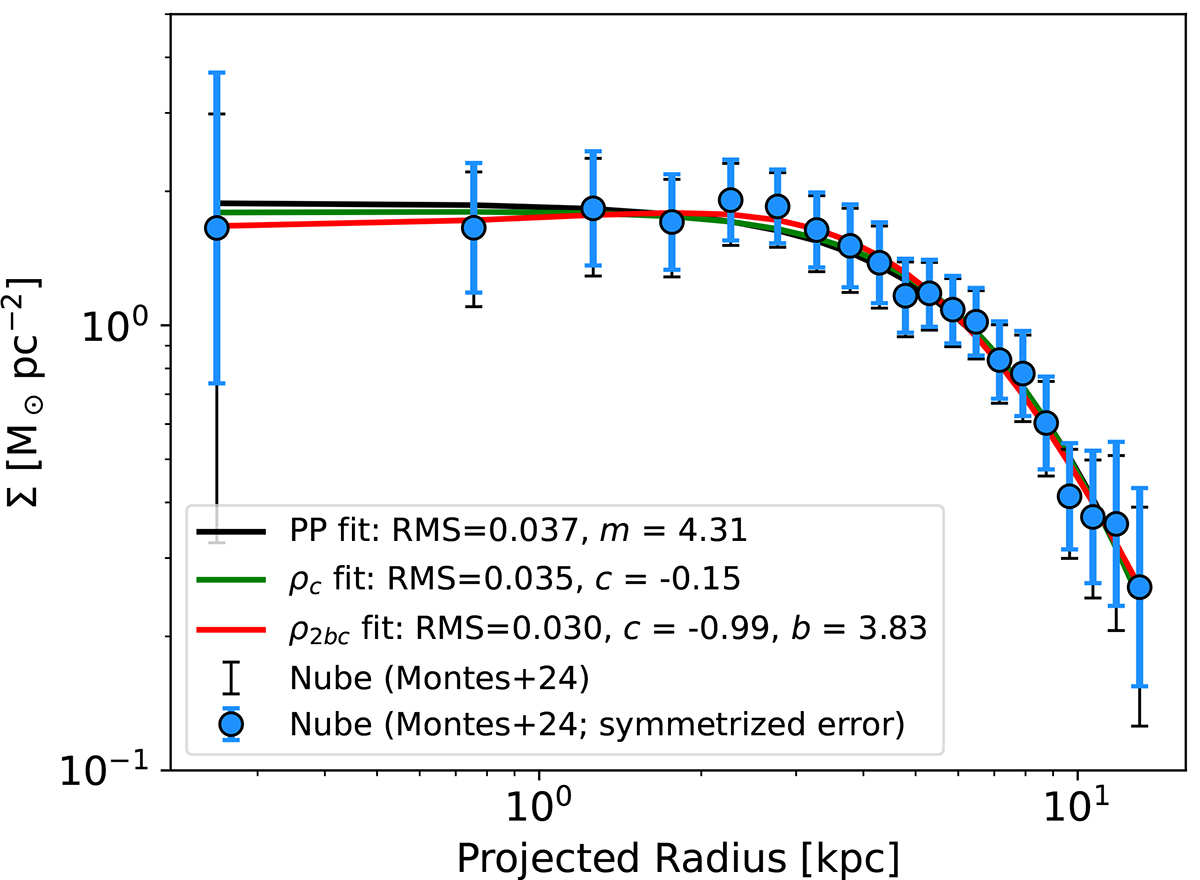
Fig. 1.
Download original image
Stellar mass surface density profile of Nube as observed by Montes et al. (2024, the symbols with error bars). The figure includes three different fits to this observation: a projected polytrope (PP; the black line, with its index m given in the inset) and two projected abc profiles (Eq. (1)). The inner slope (−c) is forced to be zero in the PP fit whereas becomes positive (i.e., c < 0) when allowed to vary (see the inset). The gray error bars are those provided by Montes et al. (symmetric in a linear scale and so asymmetric in the logarithmic representation used in the figure) whereas the symmetrized ones1 (the blue bars) are equivalent but symmetric in the logarithmic representation.
Current usage metrics show cumulative count of Article Views (full-text article views including HTML views, PDF and ePub downloads, according to the available data) and Abstracts Views on Vision4Press platform.
Data correspond to usage on the plateform after 2015. The current usage metrics is available 48-96 hours after online publication and is updated daily on week days.
Initial download of the metrics may take a while.