Fig. 8.
Download original image
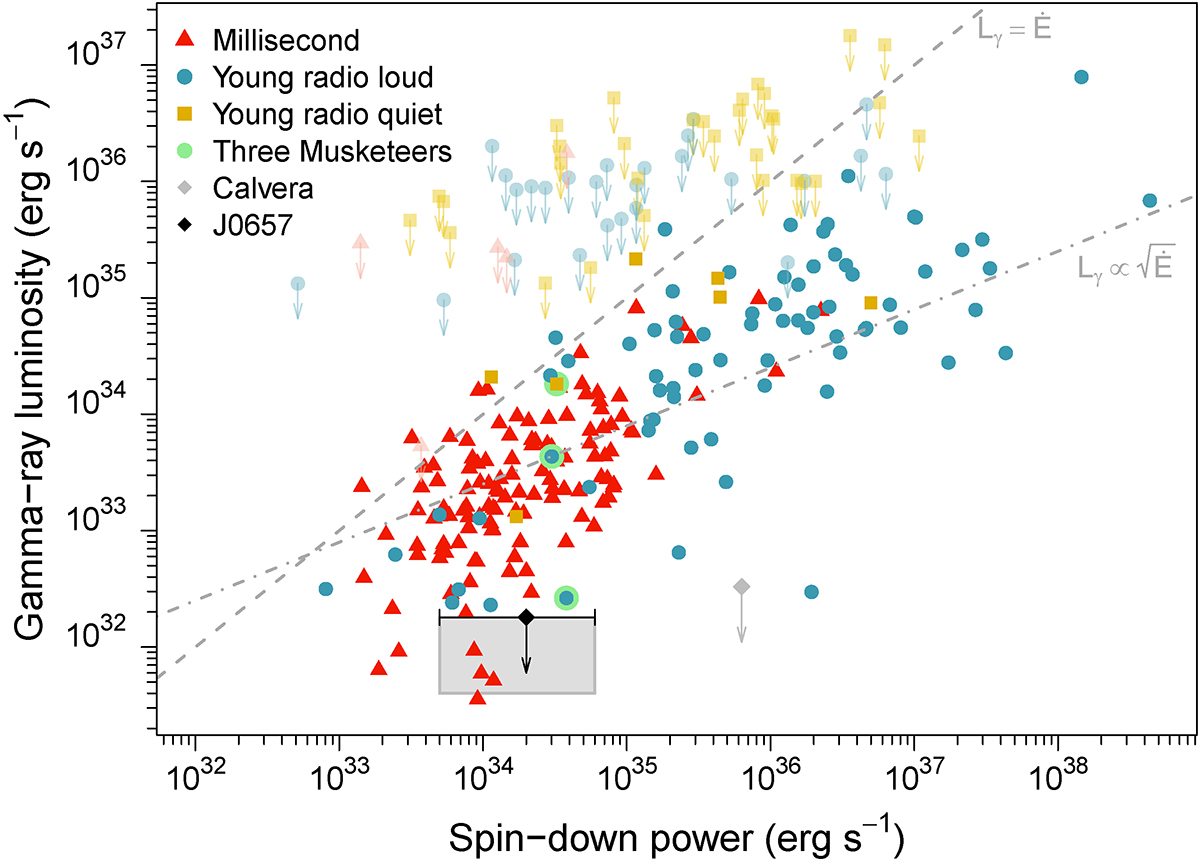
Gamma-ray luminosity (0.1 − 100 GeV) vs. spin-down power of pulsars from the Third Fermi-LAT catalogue (adapted from Smith et al. 2023). The black diamond with error bars and the shaded grey area represent the 95% c.l. upper limit on the energy flux of the target, 6.8 × 10⁻¹³ erg s−1 cm−2, at a distance range of 0.7 − 1.5 kpc. The positions of the ‘three musketeers’ and Calvera are highlighted (see legend). The upper diagonal line shows where 100% of spin-down power is converted to gamma-ray flux, while the lower diagonal line represents the heuristic relation ![]() , for reference.
, for reference.
Current usage metrics show cumulative count of Article Views (full-text article views including HTML views, PDF and ePub downloads, according to the available data) and Abstracts Views on Vision4Press platform.
Data correspond to usage on the plateform after 2015. The current usage metrics is available 48-96 hours after online publication and is updated daily on week days.
Initial download of the metrics may take a while.