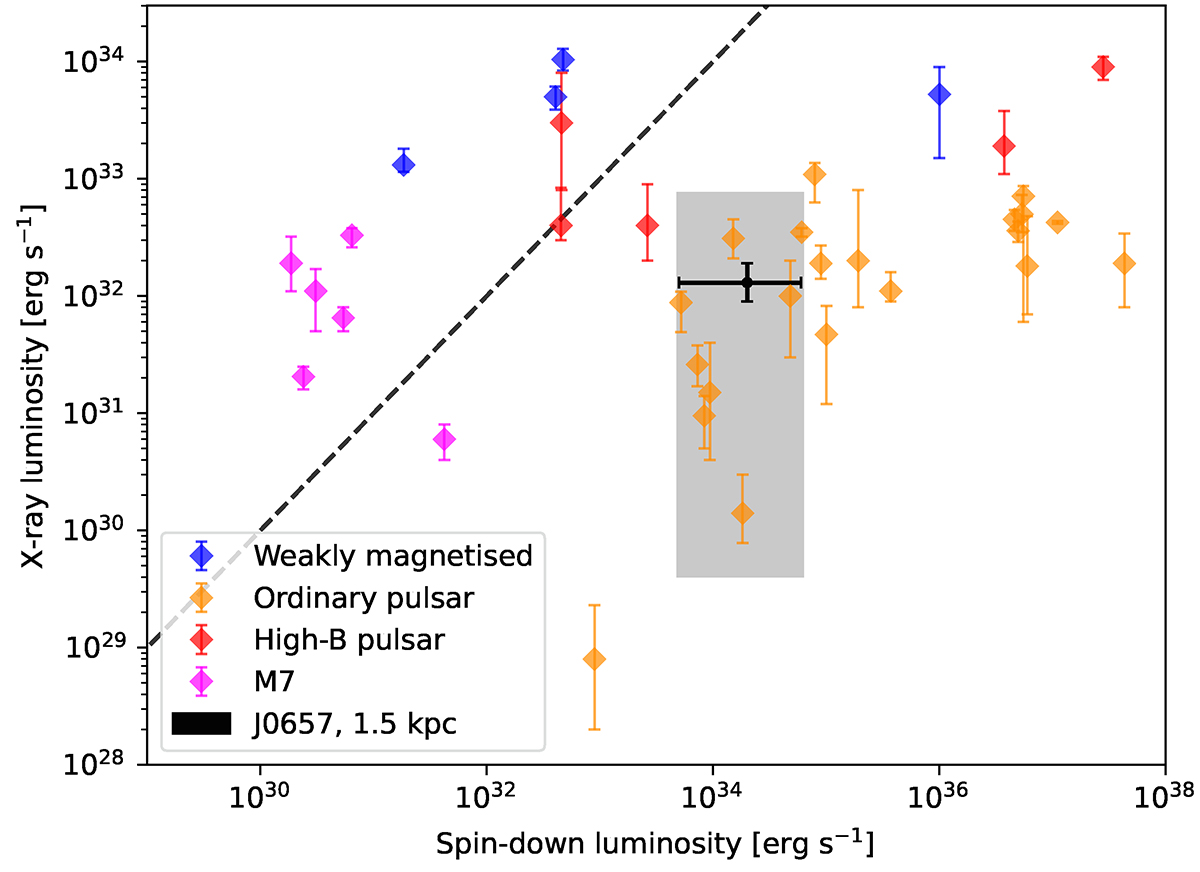
Fig. 7.
Download original image
X-ray vs. spin-down luminosity diagram showing XINSs and pulsars with notable thermal emission (Potekhin et al. 2020). The black point with error bars represents the 1σ confidence region for J0657 at a distance of 1 kpc, based on XMM-Newton and NICER timing data (Sect. 3.1). The shaded grey area shows the 1σ region for distances between 0.1 kpc and 3 kpc. The dashed line marks the identity line.
Current usage metrics show cumulative count of Article Views (full-text article views including HTML views, PDF and ePub downloads, according to the available data) and Abstracts Views on Vision4Press platform.
Data correspond to usage on the plateform after 2015. The current usage metrics is available 48-96 hours after online publication and is updated daily on week days.
Initial download of the metrics may take a while.