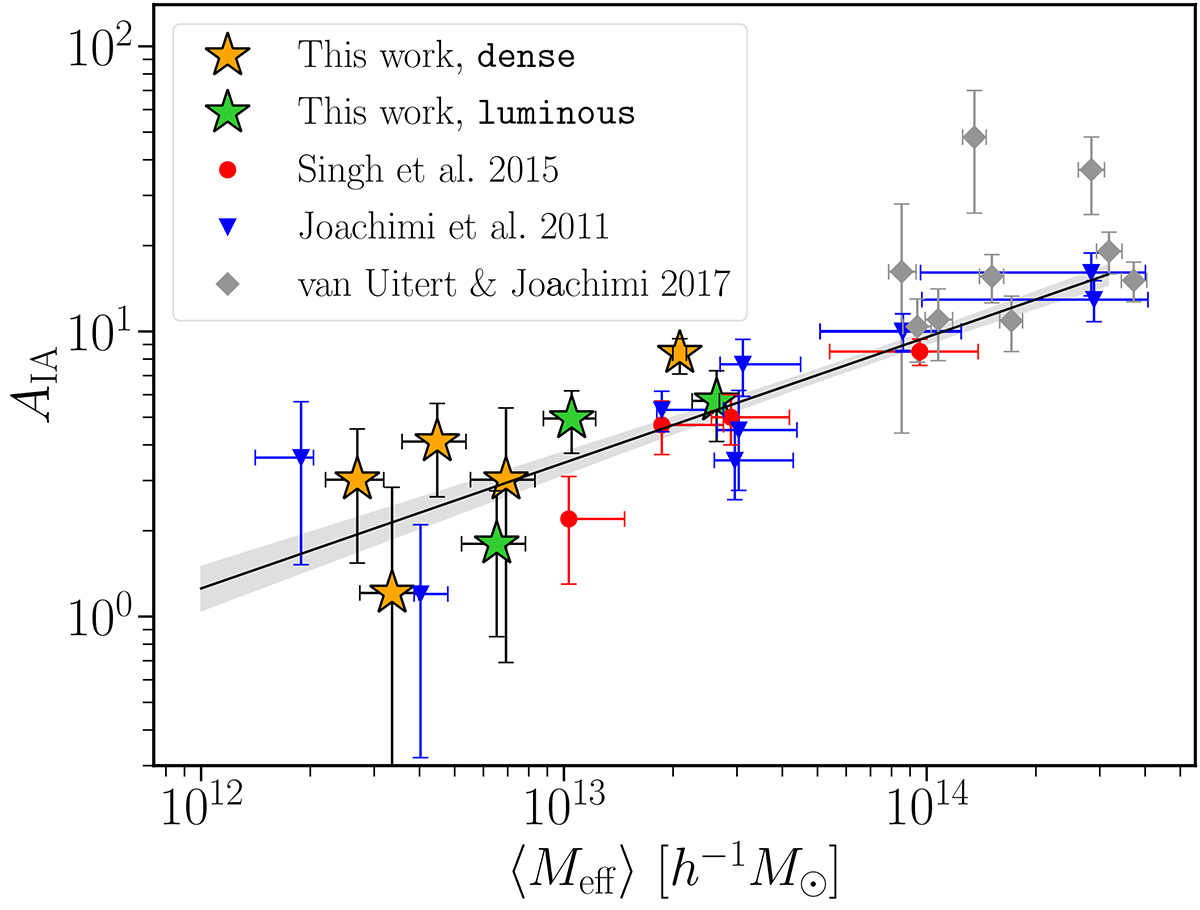
Fig. 4.
Download original image
Dependence of IA on halo mass for different IA measurements. The halo masses, ⟨Meff⟩, were obtained as described in the text. We indicate our measurements with star markers (orange: dense sample, green: luminous); the other data points are taken from the literature. The solid black line shows the best fit curve of the AIA(M) relation described by Eq. (6.1), while the shaded area delimits the 68% confidence region.
Current usage metrics show cumulative count of Article Views (full-text article views including HTML views, PDF and ePub downloads, according to the available data) and Abstracts Views on Vision4Press platform.
Data correspond to usage on the plateform after 2015. The current usage metrics is available 48-96 hours after online publication and is updated daily on week days.
Initial download of the metrics may take a while.