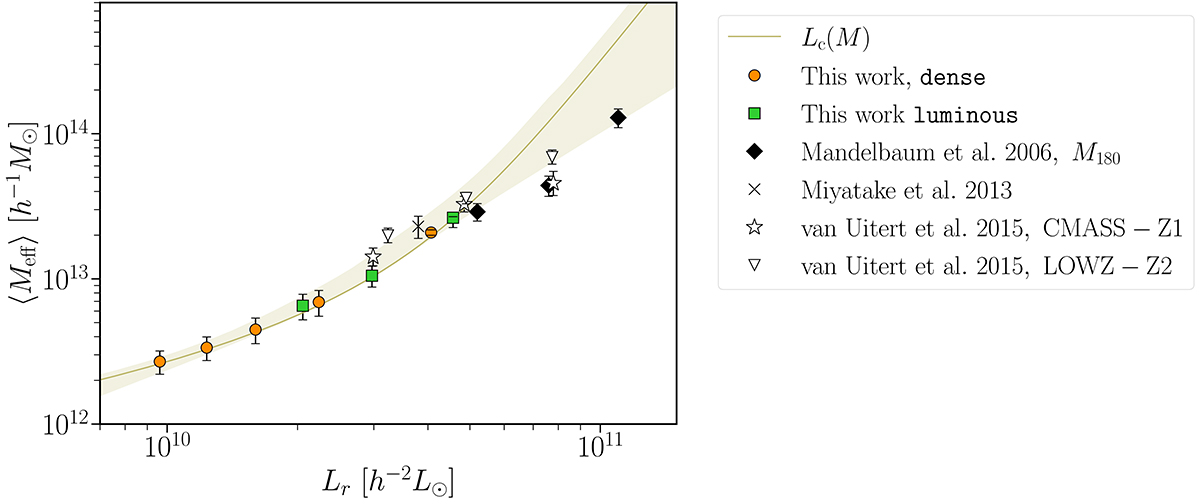
Fig. 3.
Download original image
Luminosity-halo mass relation for the LRG sample (dense orange circles; luminous: green squares), compared with similar measurements from different samples in the literature. The solid line shows the Lc(M) relation predicted by our model. We caution that the points from the literature use somewhat different mass definitions and, thus, the comparison is intended for qualitative purposes only.
Current usage metrics show cumulative count of Article Views (full-text article views including HTML views, PDF and ePub downloads, according to the available data) and Abstracts Views on Vision4Press platform.
Data correspond to usage on the plateform after 2015. The current usage metrics is available 48-96 hours after online publication and is updated daily on week days.
Initial download of the metrics may take a while.