Fig. 6
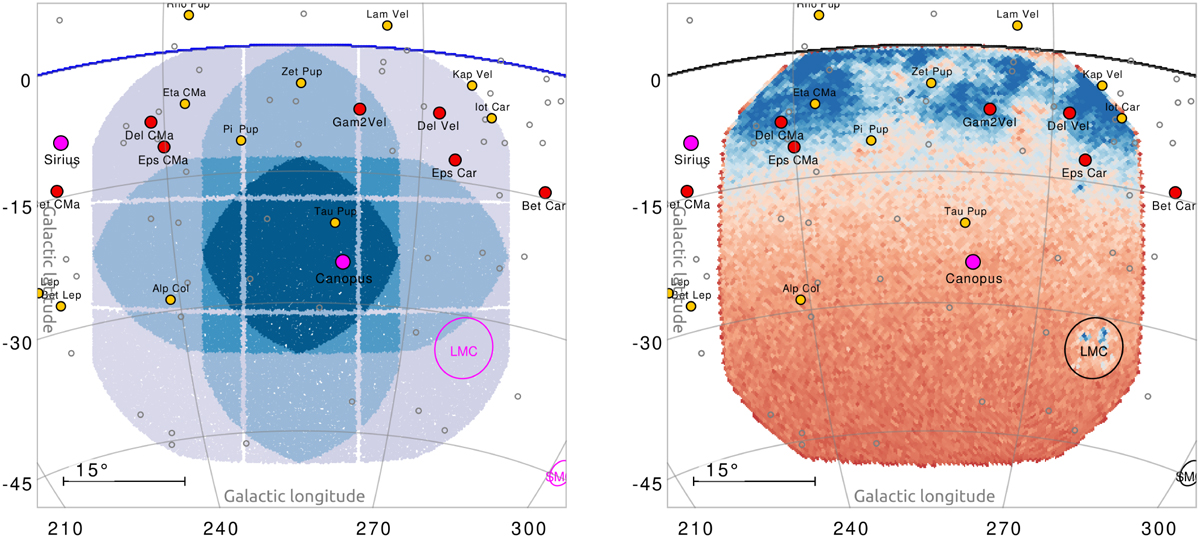
Download original image
Bright stars and stellar crowding in LOPS2. Left panel: orthographic projection in galactic coordinates centered on LOPS2. The field is color coded according to the number of NCAMs as in Fig. 1. The brightest stars from the Yale Bright Star Catalog are plotted as circles of different colors: magenta (V < 1), red (1 < V < 2), yellow (2 < V < 3), gray (3 < V < 4). Right panel: same but the footprint of LOPS2 is color coded according to the areal density of G < 13.5 stars from Gaia DR3. The color scale increases proportionally to density from orange to blue with a transition at ~400 targets per deg2, at b ≃ −15°.
Current usage metrics show cumulative count of Article Views (full-text article views including HTML views, PDF and ePub downloads, according to the available data) and Abstracts Views on Vision4Press platform.
Data correspond to usage on the plateform after 2015. The current usage metrics is available 48-96 hours after online publication and is updated daily on week days.
Initial download of the metrics may take a while.