Fig. 2
Download original image
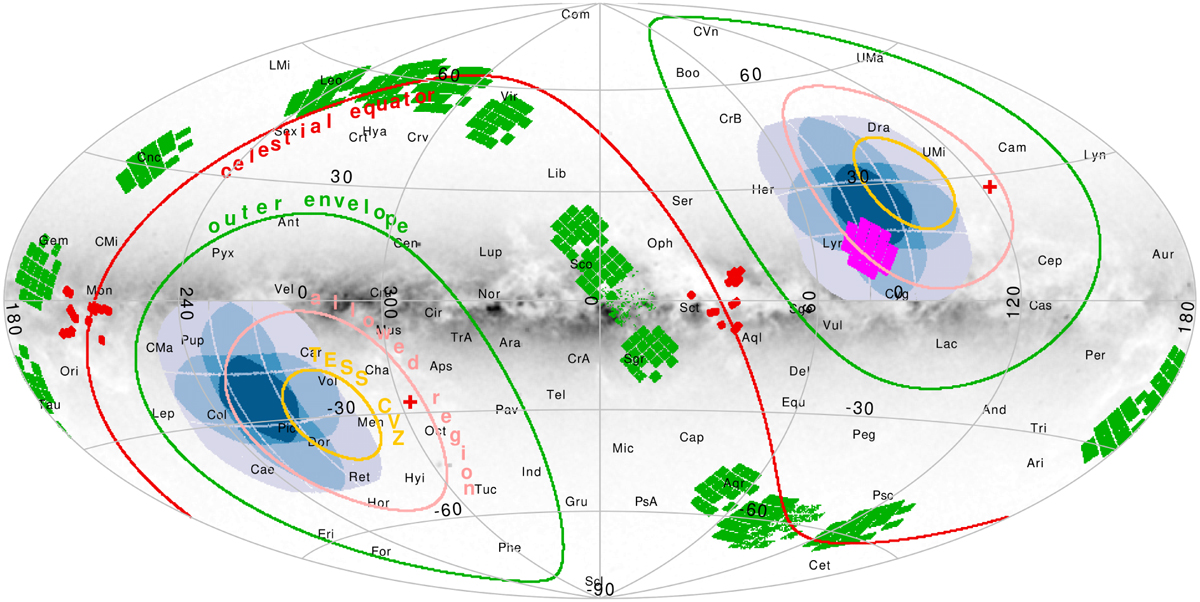
All-sky Aitoff projection in galactic coordinates of LOPS2 and LOPN1, showing the formal constraints for the selection of the PLATO LOP fields and the synergies with other missions. The two pink circles represent the |β| > 63° technical requirement for the center of the LOP fields (“allowed region”), implying that the overall envelopes of every allowed field choice are two ecliptic caps at |β| ≳ 38° (green circles). LOPS2 (lower left) and LOPN1 (upper right) are plotted with blue shades according to the number of co-pointing cameras, as in Fig. 1. The footprints of CoRoT (red), Kepler (magenta), and K2 (green) are over-plotted together with the TESS continuous viewing zone at |β| ≳ 78° (yellow circle). The background gray layer is color coded according to the areal density of G < 13.5 stars from Gaia DR3. The celestial equator and poles are marked with a red line and crosses, respectively. This sky chart is also plotted in equatorial and Ecliptic coordinates in Figs. B.4 and B.5 on Zenodo.
Current usage metrics show cumulative count of Article Views (full-text article views including HTML views, PDF and ePub downloads, according to the available data) and Abstracts Views on Vision4Press platform.
Data correspond to usage on the plateform after 2015. The current usage metrics is available 48-96 hours after online publication and is updated daily on week days.
Initial download of the metrics may take a while.