Fig. 3.
Download original image
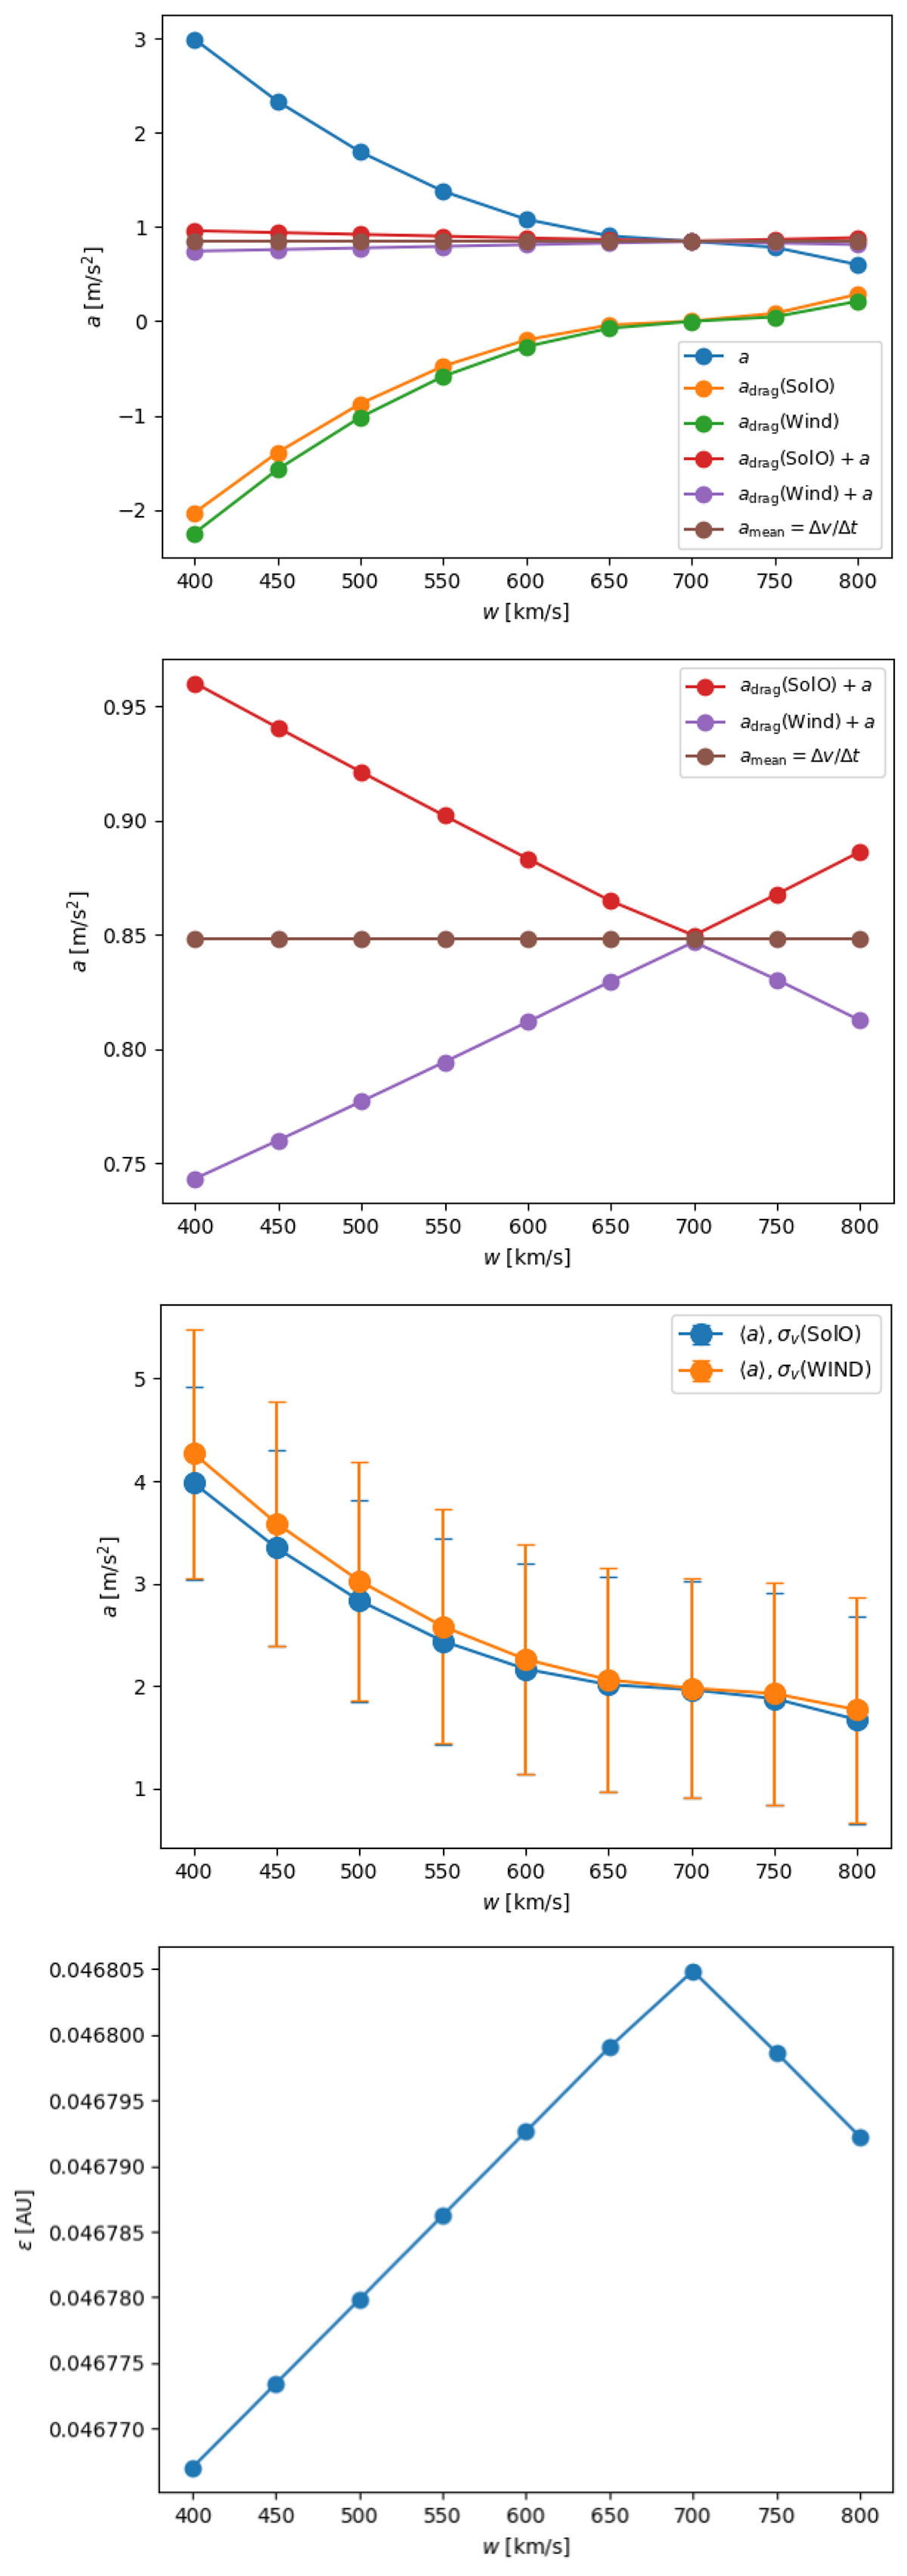
Modeling the November 3–5, 2021, event with the EDBM. First panel from top: Extra-acceleration term predicted by the EDBM (cyan line) added to the acceleration terms predicted by the DBM at SolO (orange line) and Wind (green line) to obtain the red and purple lines that are compared to the experimental average acceleration from SolO to Wind (brown line). Second panel: Zoom on the experimental average and predicted accelerations. Third panel: Mean acceleration and corresponding standard deviation provided by the EDBM for ten random realizations of the initial and final speeds (blue and orange lines, respectively). Fourth panel: Absolute error, ε = |fr(a)|, from Eq. (15) at Wind for the EDBM solutions, a, obtained as in the topmost panel using Eq. (14).
Current usage metrics show cumulative count of Article Views (full-text article views including HTML views, PDF and ePub downloads, according to the available data) and Abstracts Views on Vision4Press platform.
Data correspond to usage on the plateform after 2015. The current usage metrics is available 48-96 hours after online publication and is updated daily on week days.
Initial download of the metrics may take a while.