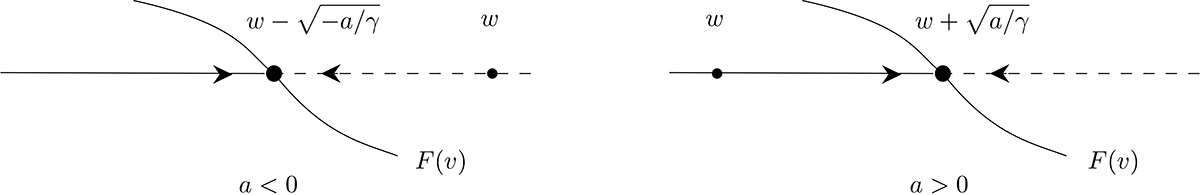
Fig. 1.
Download original image
Graphical representation of F(v)≔ − γ|v − w|(v − w)+a and local portrait of the speed dynamics around the stable equilibrium of the EDBM in the cases a < 0 and a > 0. The arrows define the positive sense of time for the evolution of v(t). Solid and dashed lines correspond to F > 0 (graph above the line, arrow pointing to the right) and F < 0 (graph below the line, arrow pointing to the left), respectively.
Current usage metrics show cumulative count of Article Views (full-text article views including HTML views, PDF and ePub downloads, according to the available data) and Abstracts Views on Vision4Press platform.
Data correspond to usage on the plateform after 2015. The current usage metrics is available 48-96 hours after online publication and is updated daily on week days.
Initial download of the metrics may take a while.