Fig. 4.
Download original image
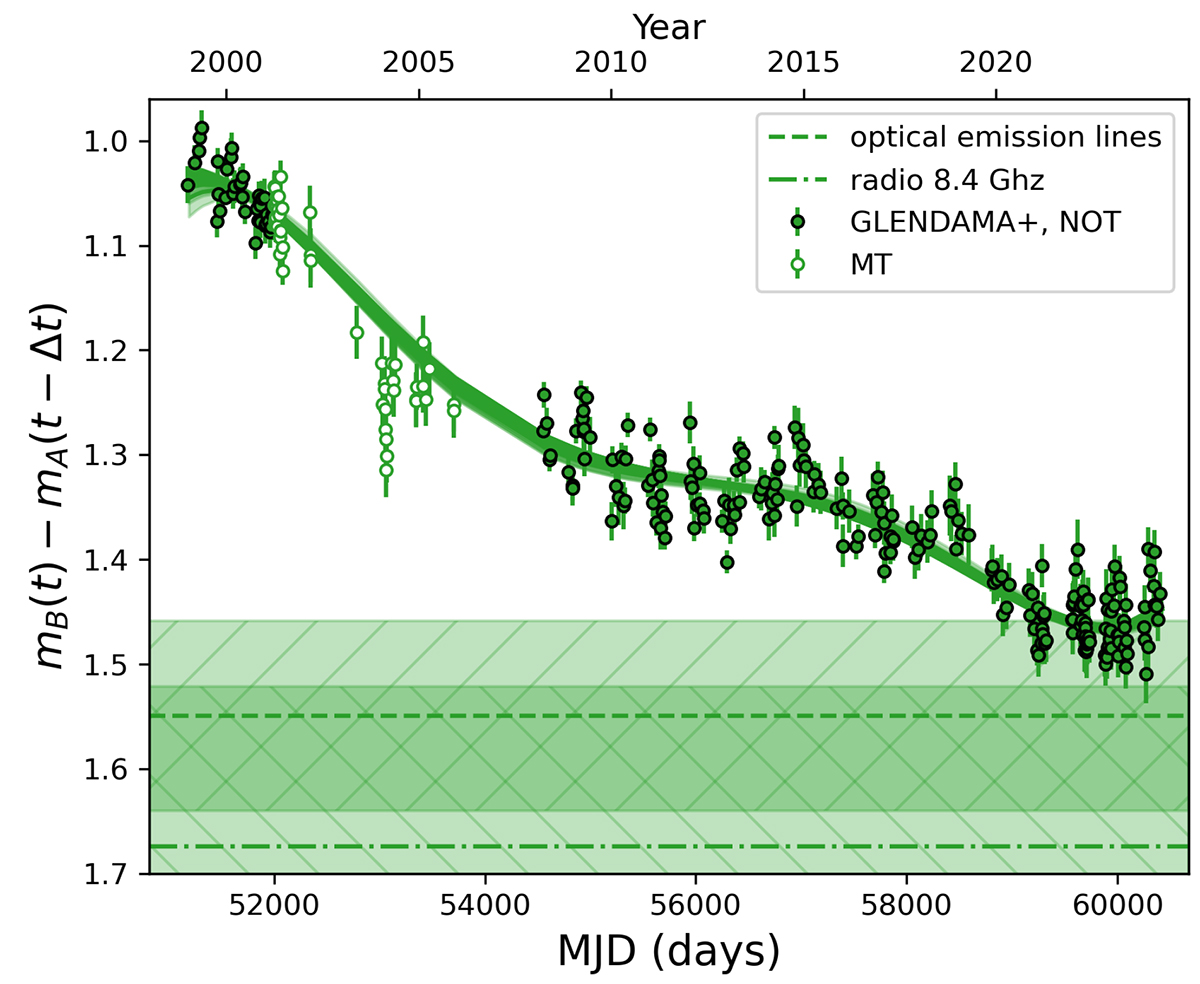
New 25 yr DLC of FBQ 0951+2635 in the red optical passbands from NOT-MT and GLENDAMA+ data. We also show solutions of the fifth-degree microlensing polynomial (thick solid line; see main text for details). For comparison purposes, we include the magnitude differences from VLA data (horizontal dash-dotted line; Jakobsson et al. 2005) and emission lines (horizontal dashed line; see Sect. 3.1). The striped rectangles represent the uncertainties in these two differences.
Current usage metrics show cumulative count of Article Views (full-text article views including HTML views, PDF and ePub downloads, according to the available data) and Abstracts Views on Vision4Press platform.
Data correspond to usage on the plateform after 2015. The current usage metrics is available 48-96 hours after online publication and is updated daily on week days.
Initial download of the metrics may take a while.