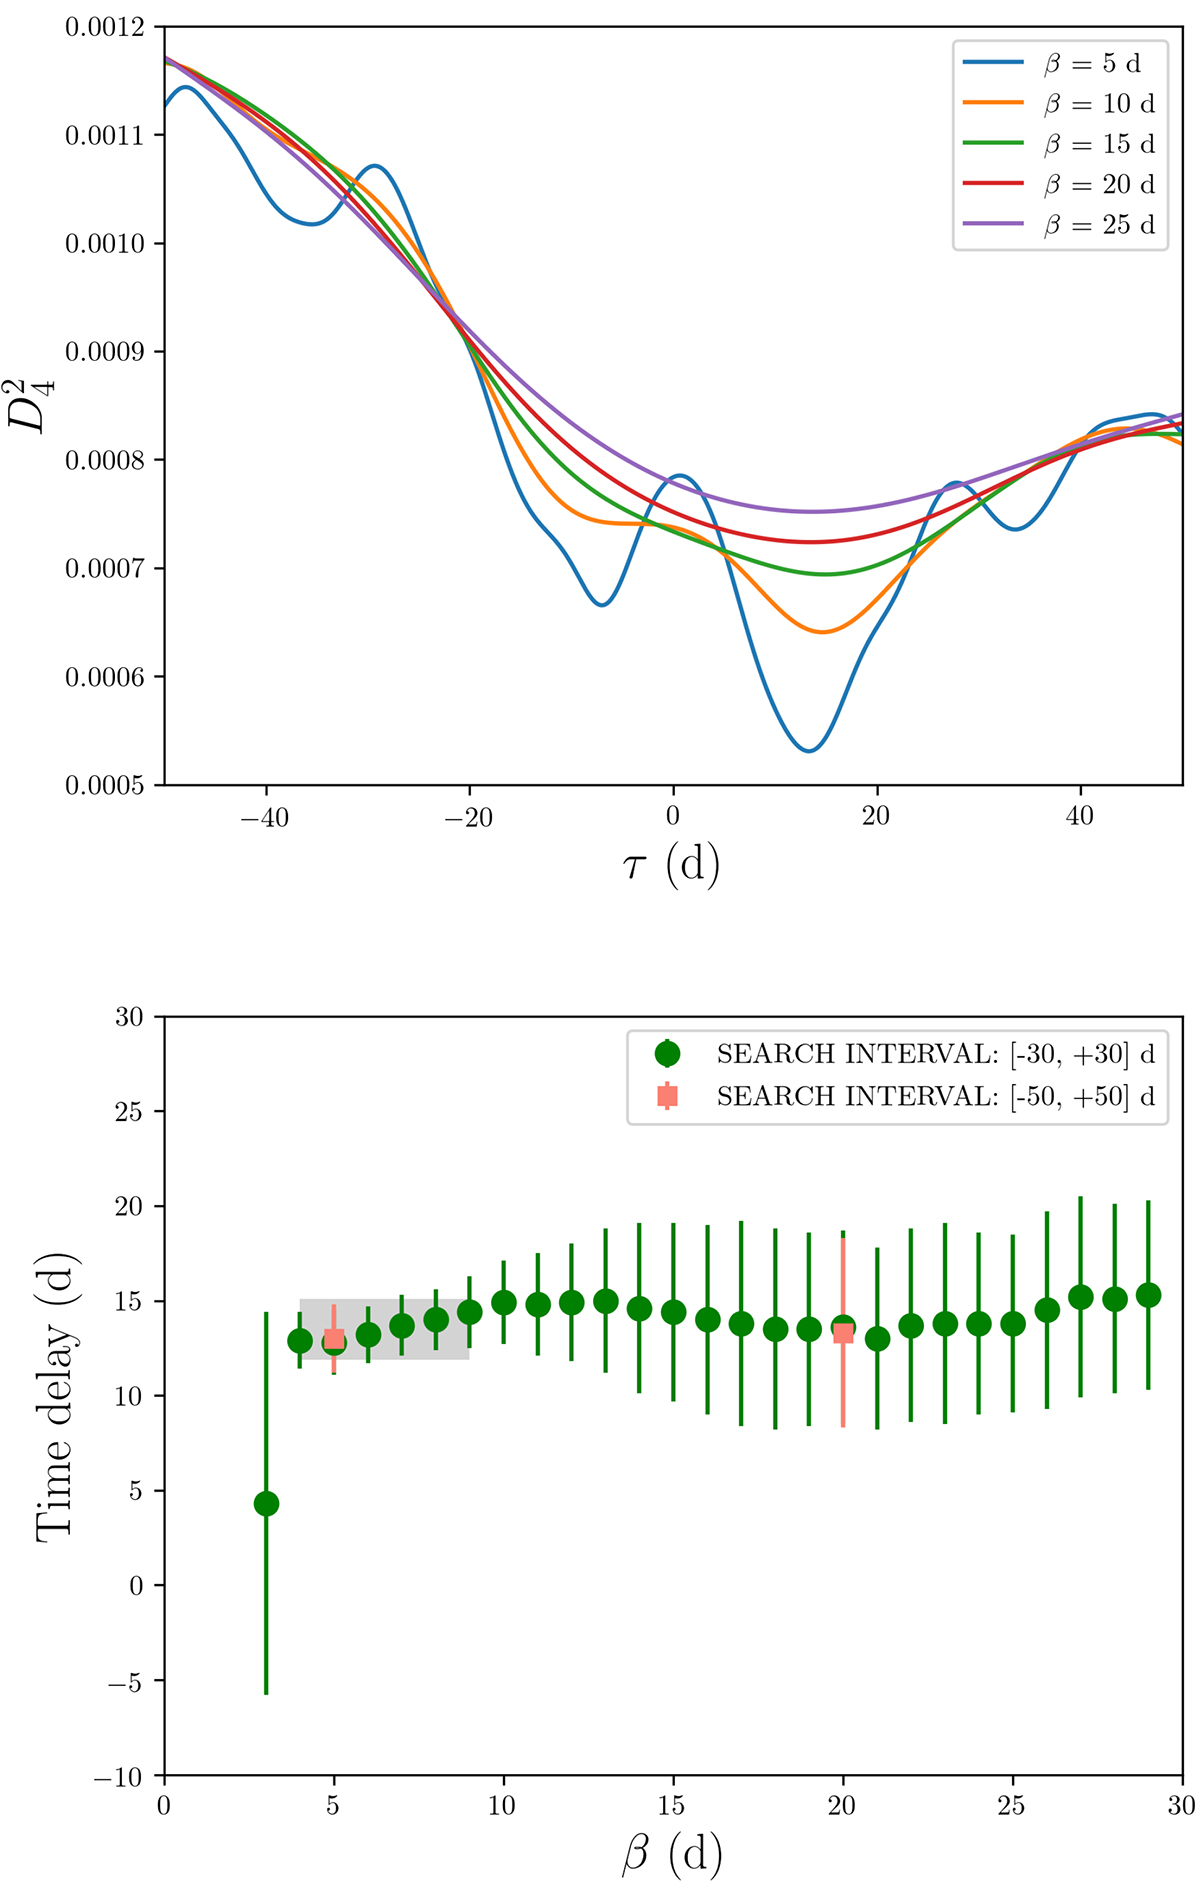
Fig. 2.
Download original image
Time-delay estimation from the dispersion technique. The dispersion spectra D42 are based on a Gaussian weighting function whose width is described by the parameter β, as well as a fifth-degree microlensing polynomial (Nml = 5; see main text). Top panel: D42 spectra using the NOT light curves plus the new GLENDAMA+ brightness records and five values of β. These spectra have minima at time lags τ = 13–15 d. Bottom panel: 1σ confidence intervals for the time delay using 1000 synthetic light curves of each image and a large set of β values. A combined measurement from the six delay intervals for β = 4–9 d is highlighted with a light grey rectangle encompassing the individual measurements.
Current usage metrics show cumulative count of Article Views (full-text article views including HTML views, PDF and ePub downloads, according to the available data) and Abstracts Views on Vision4Press platform.
Data correspond to usage on the plateform after 2015. The current usage metrics is available 48-96 hours after online publication and is updated daily on week days.
Initial download of the metrics may take a while.