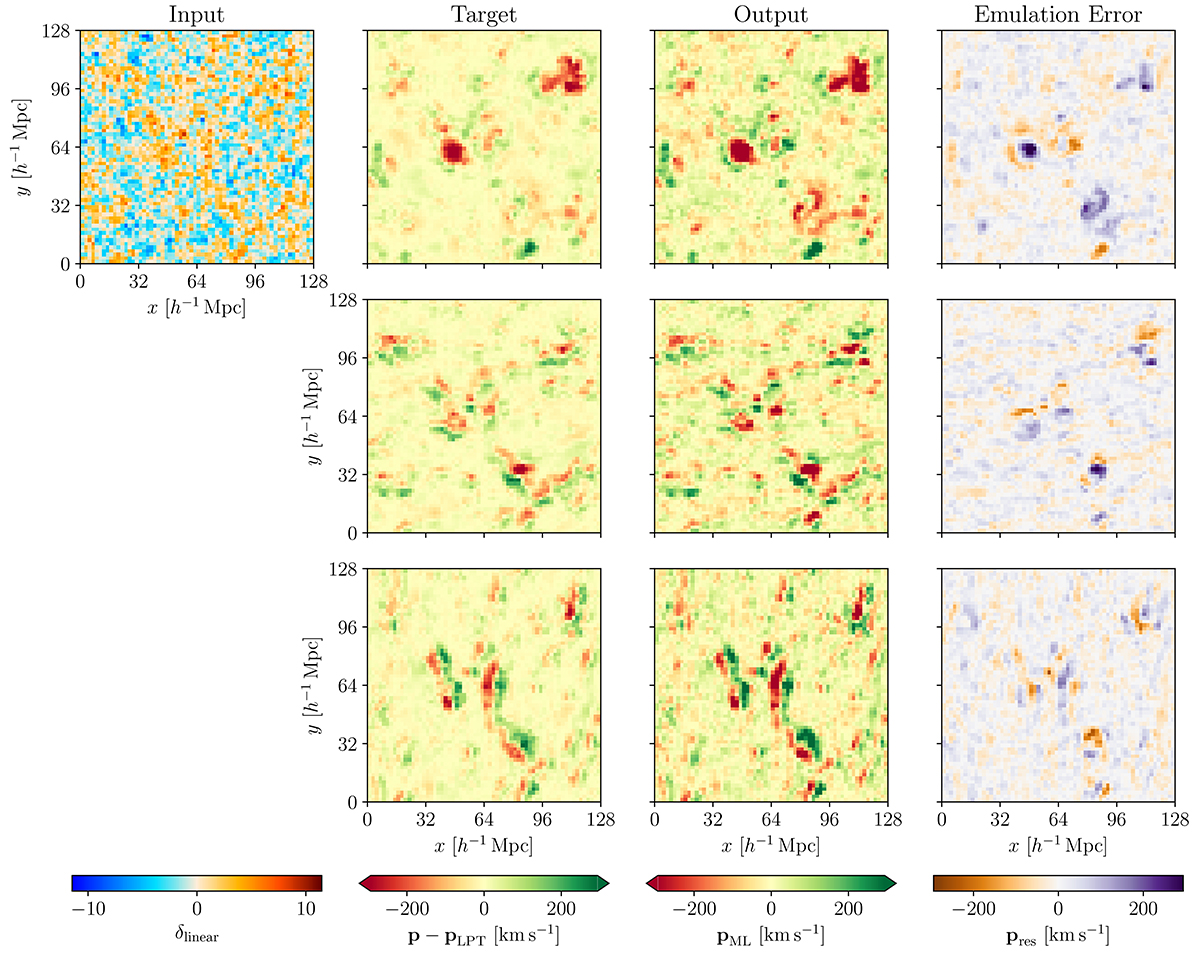
Fig. 5.
Download original image
Slices of the input, target, output, and error of the frame of reference emulator at the final time step (i.e. with style parameter a = 1). The input is the (scalar) linear density field (first column). The emulator aims to predict the three components (one per row) of its target p − pLPT (second column). The emulator’s predictions are shown in the third column, and the emulation error pres = p − pLPT − pML, is shown in the final column.
Current usage metrics show cumulative count of Article Views (full-text article views including HTML views, PDF and ePub downloads, according to the available data) and Abstracts Views on Vision4Press platform.
Data correspond to usage on the plateform after 2015. The current usage metrics is available 48-96 hours after online publication and is updated daily on week days.
Initial download of the metrics may take a while.