Fig. 3.
Download original image
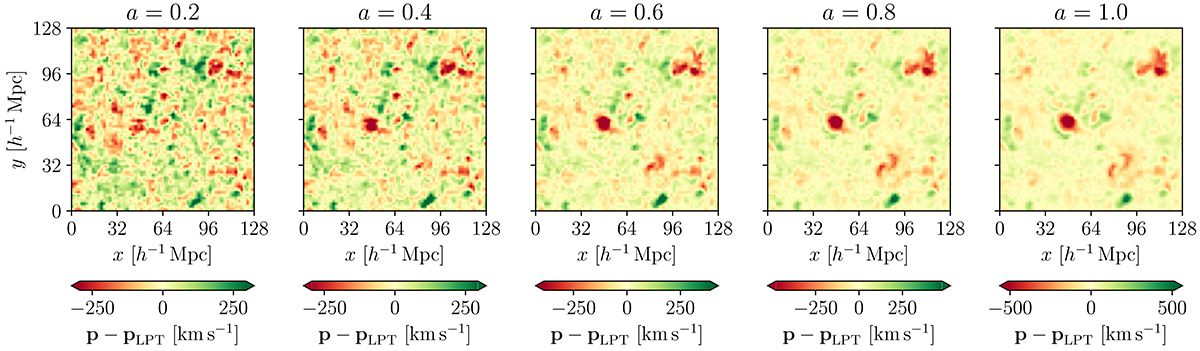
Slice of the difference between the true momenta of particles p and the LPT prediction pLPT, for a test simulation, as a function of scale factor a. We plot the component orthogonal to the chosen slice. At late times, the spatial structure of the field p − pLPT remains relatively constant, with most of the time dependence being a simple multiplicative scaling.
Current usage metrics show cumulative count of Article Views (full-text article views including HTML views, PDF and ePub downloads, according to the available data) and Abstracts Views on Vision4Press platform.
Data correspond to usage on the plateform after 2015. The current usage metrics is available 48-96 hours after online publication and is updated daily on week days.
Initial download of the metrics may take a while.