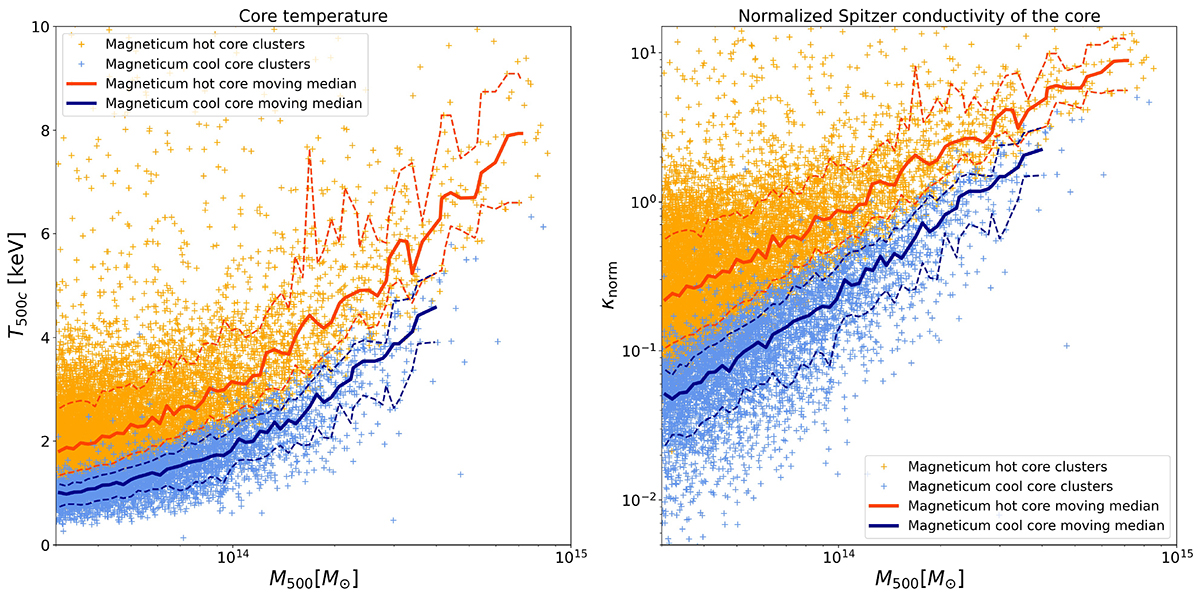
Fig. 5.
Download original image
Thermal conductivity. Cool-core clusters are shown in blue, and hot-core clusters in orange. Solid lines indicate moving medians, and dashed lines indicate 16% and 84% percentiles (2σ) from the Magneticum simulation (Box2b/hr). Left panel: Temperature of the core region obtained with emissivity weights in the XMM-eFEDS band. Right panel: Effective Spitzer conductivity coefficient for the core temperature, normalised to the value for a system at 1 keV.
Current usage metrics show cumulative count of Article Views (full-text article views including HTML views, PDF and ePub downloads, according to the available data) and Abstracts Views on Vision4Press platform.
Data correspond to usage on the plateform after 2015. The current usage metrics is available 48-96 hours after online publication and is updated daily on week days.
Initial download of the metrics may take a while.