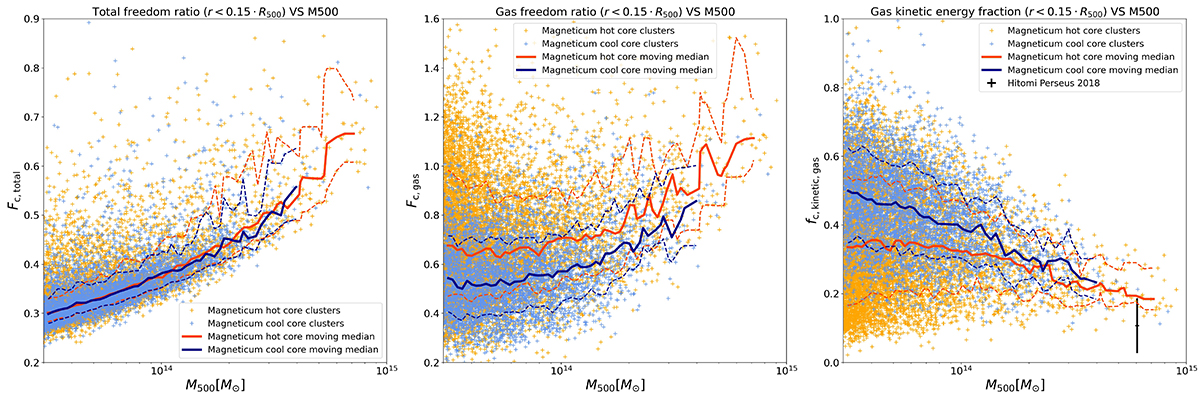
Fig. 4.
Download original image
Dynamical analysis. Cool-core clusters are shown in blue, and hot-core clusters in orange. Solid lines indicate moving medians, and dashed lines indicate 16% and 84% percentiles (2σ) from the Magneticum simulation (Box2b/hr). Left panel: Freedom ratio for all particles inside the core region (Fc, total). Central panel: Freedom ratio for gas particles inside the core region (Fc, gas). Right panel: Kinetic energy fraction fc, gas, kinetic for gas particles inside the core region. The black bar indicates the first and only measurement of kinetic energy fraction in galaxy clusters, of 10% measured for the Perseus cluster by Hitomi (Hitomi Collaboration 2018).
Current usage metrics show cumulative count of Article Views (full-text article views including HTML views, PDF and ePub downloads, according to the available data) and Abstracts Views on Vision4Press platform.
Data correspond to usage on the plateform after 2015. The current usage metrics is available 48-96 hours after online publication and is updated daily on week days.
Initial download of the metrics may take a while.