Fig. 3.
Download original image
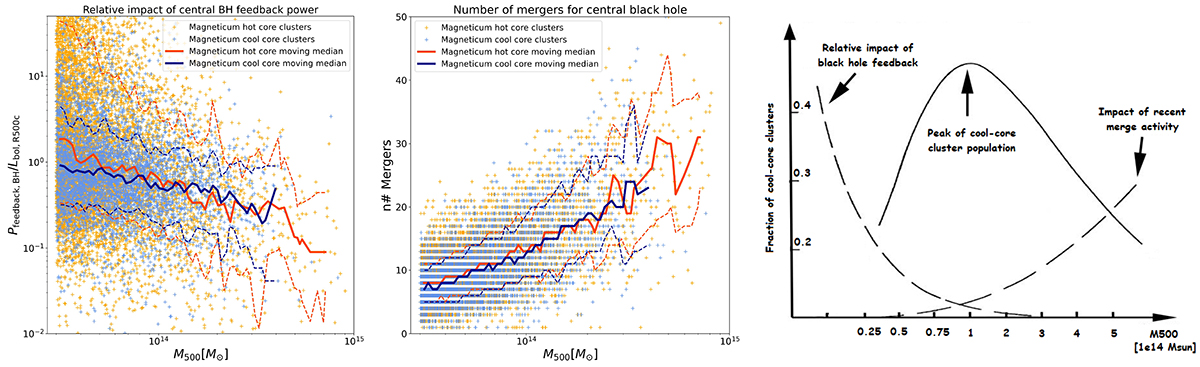
Driving factors behind the cool-core fraction characteristic curve. The left and central panels correspond to results from the Magneticum simulation (Box2b), where cool-core clusters are shown in blue and hot-core clusters in orange. Solid lines indicate moving medians, and dashed lines indicate 16% and 84% percentiles (1σ). Left panel: Ratio between the energy injection from the central AGN feedback and the bolometric luminosity in the [0.01−100] keV band for gas particles inside the core region. Central panel: Number of mergers undergone by the central black hole of the brightest cluster galaxy (BCG). Right panel: Sketch to illustrate the concept of how the driving factors combine to produce the characteristic shape of the cool-core fraction curve.
Current usage metrics show cumulative count of Article Views (full-text article views including HTML views, PDF and ePub downloads, according to the available data) and Abstracts Views on Vision4Press platform.
Data correspond to usage on the plateform after 2015. The current usage metrics is available 48-96 hours after online publication and is updated daily on week days.
Initial download of the metrics may take a while.