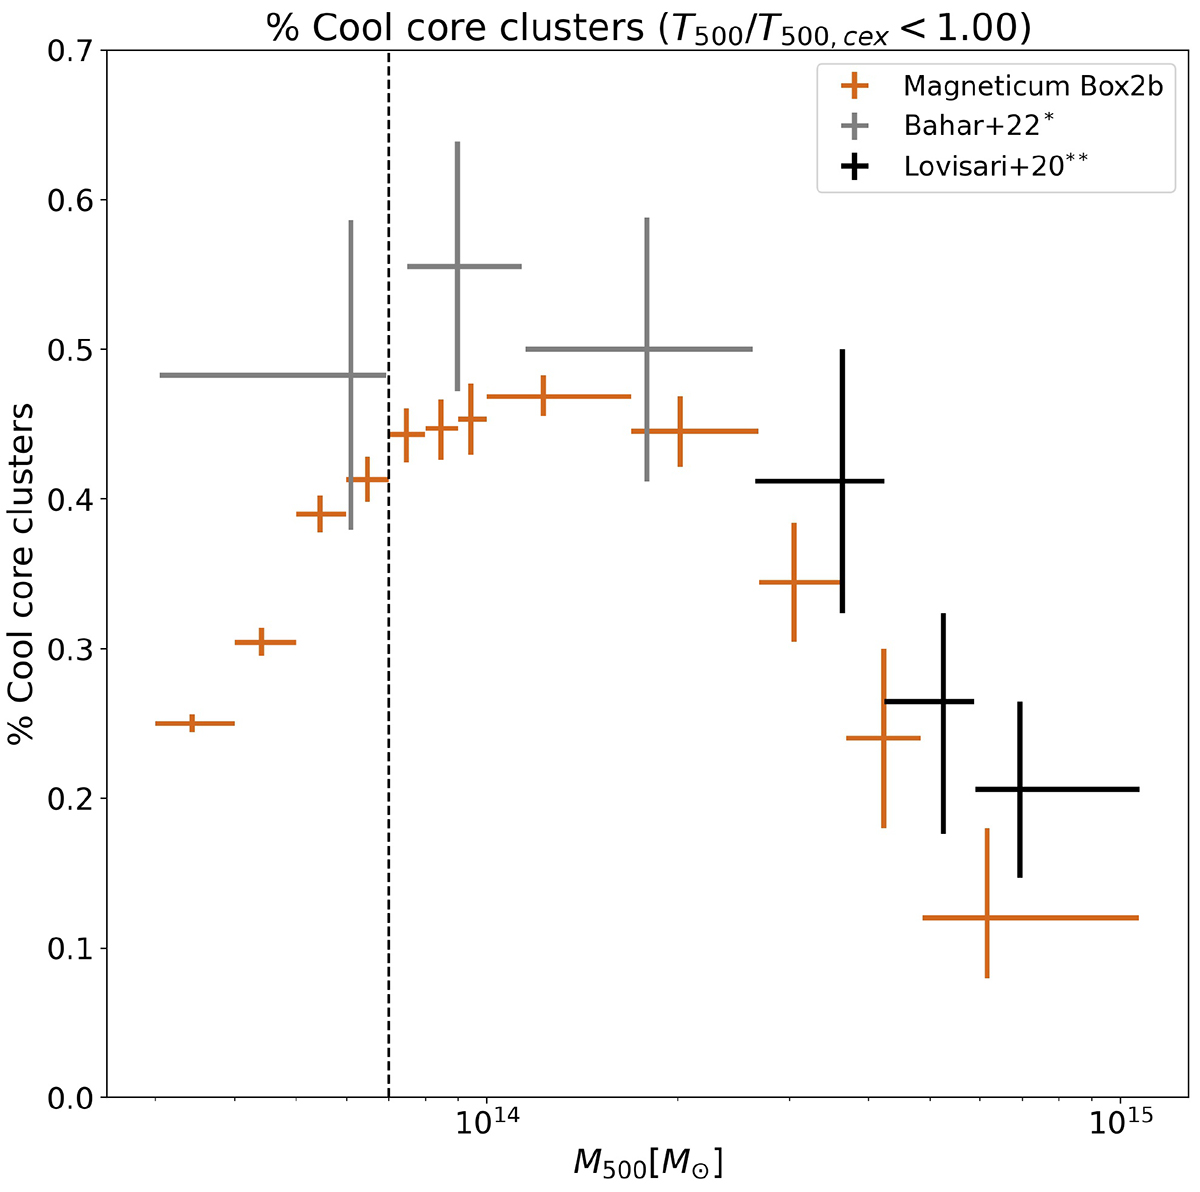
Fig. 2.
Download original image
Observed and simulated cool-core fractions. The gold bars correspond to the simulation, for which the temperature was obtained with emissivity weights in the XMM-eFEDS band. The grey bars for the low-mid mass range correspond to the eROSITA field equatorial deep survey eFEDS data from Bahar et al. (2022) and Chiu et al. (2022). (*Also contains 1 mid-mass cluster from the Lovisari et al. 2020 sample). The black bars for the high mass range correspond to the Planck SZ-selected sample observed with XMM-Newton from Lovisari et al. (2020). (**Also contains 10 high mass clusters from the Bahar et al. 2022 sample). The vertical dashed line corresponds to M500c = 0.7 ⋅ 1013 M⊙, above which the eFEDS survey is expected to be complete for redshifts below z < 0.3 (Comparat et al. 2020).
Current usage metrics show cumulative count of Article Views (full-text article views including HTML views, PDF and ePub downloads, according to the available data) and Abstracts Views on Vision4Press platform.
Data correspond to usage on the plateform after 2015. The current usage metrics is available 48-96 hours after online publication and is updated daily on week days.
Initial download of the metrics may take a while.