Fig. 12.
Download original image
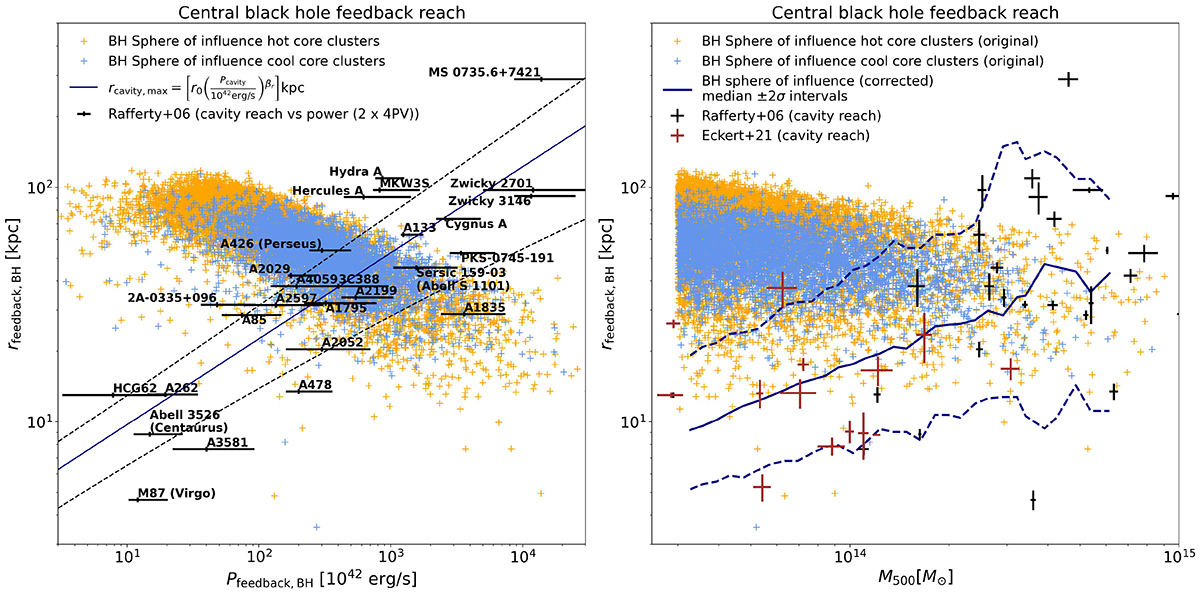
Size of the sphere of influence of the simulated AGNs in the centres of groups and clusters. Cool-core clusters are shown in blue, and hot-core clusters are shown in orange. Observational data from Rafferty et al. (2006) and Eckert et al. (2021) is shown with error bars at the 1σ level. Left panel: Size vs power. Shown is the maximum size or distance of cavities in observed groups and clusters versus cavity power, whereas for the simulation we show the ‘black hole sphere of influence’ versus the AGN energy injection. The dark blue solid line shows the power law fit described by Equation (9), and the dashed lines represent ±1σ confidence intervals. Right panel: Same as the left panel, but plotting versus M500c in the X-axis.
Current usage metrics show cumulative count of Article Views (full-text article views including HTML views, PDF and ePub downloads, according to the available data) and Abstracts Views on Vision4Press platform.
Data correspond to usage on the plateform after 2015. The current usage metrics is available 48-96 hours after online publication and is updated daily on week days.
Initial download of the metrics may take a while.