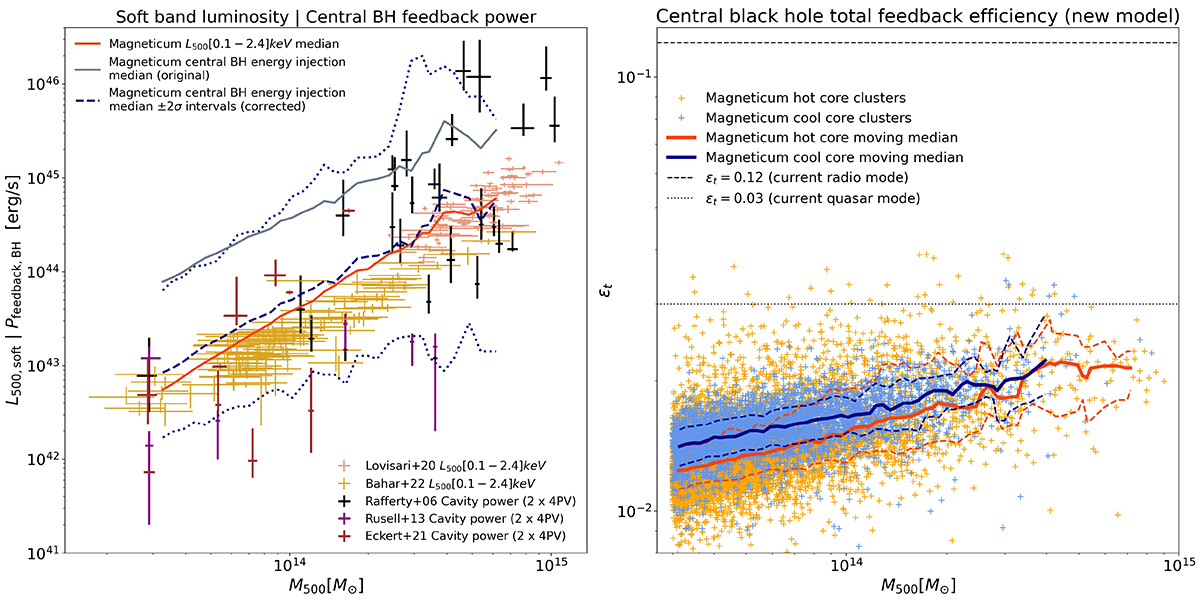
Fig. 11.
Download original image
Soft luminosity vs. original AGN energy injection and corrected efficiency model. Left panel: Alignment of soft band luminosity with the central AGN feedback. The golden and salmon bars correspond to the ICM L500 luminosity in the [0.1−2.4] keV (soft) band from the Bahar et al. (2022) and Lovisari et al. (2020) samples, respectively, whereas the black, magenta, and brown bars correspond to the cavity powers from Rafferty et al. (2006), Russell et al. (2013), and the kinetic luminosity sample from Pasini et al. (2022), respectively. Observational error bars are at the 1σ level. The solid orange-red and grey lines correspond to the luminosity and original AGN feedback model obtained from the simulation, whereas the blue dashed line corresponds to the ‘corrected’ AGN feedback model obtained from the simulation using Eq. (7), and the blue dotted lines are the corresponding 2σ level intervals. Right panel: Total black hole efficiency in radio mode following the new model described by Eq. (8) based on the original accretion rates from the simulation shown in the left panel of Fig. 10. Cool-core clusters are shown in blue, and hot-core clusters are shown in orange. Solid lines indicate moving medians, and dashed lines represent 16% and 84% percentiles (1σ) from the Magneticum simulation (Box2b/hr). For comparison, the total black hole efficiencies in radio and quasar modes are shown with a dashed and dotted line, respectively.
Current usage metrics show cumulative count of Article Views (full-text article views including HTML views, PDF and ePub downloads, according to the available data) and Abstracts Views on Vision4Press platform.
Data correspond to usage on the plateform after 2015. The current usage metrics is available 48-96 hours after online publication and is updated daily on week days.
Initial download of the metrics may take a while.