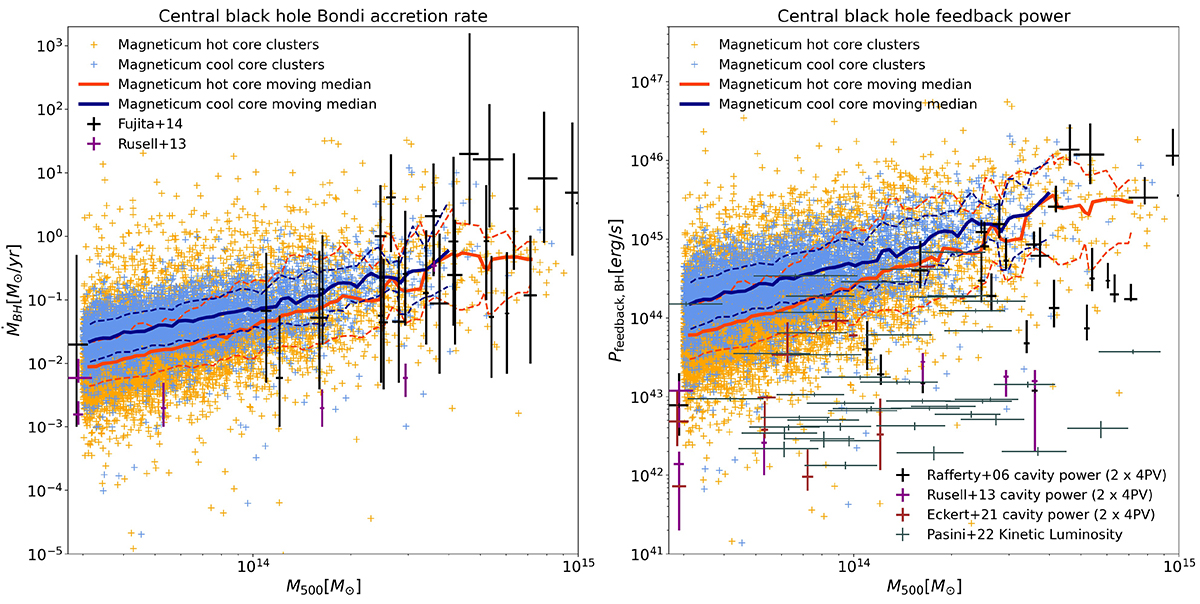
Fig. 10.
Download original image
Accretion rates and energy injection of the AGN hosted in the centres on BCGs. Cool-core clusters are shown in blue, and hot-core clusters are shown in orange. Solid lines indicate moving medians, and dashed lines represent 16% and 84% percentiles (1σ) from the Magneticum simulation (Box2b/hr). Observational data is shown with error bars at the 1σ level. Left panel: Comparison of the accretion rates from the AGN hosted in the centres on BCGs, with the estimations from Fujita et al. (2014) and Russell et al. (2013). Right panel: Comparison of black hole energy injection with the observational estimations from Rafferty et al. (2006), Russell et al. (2013), Eckert et al. (2021) and Pasini et al. (2022).
Current usage metrics show cumulative count of Article Views (full-text article views including HTML views, PDF and ePub downloads, according to the available data) and Abstracts Views on Vision4Press platform.
Data correspond to usage on the plateform after 2015. The current usage metrics is available 48-96 hours after online publication and is updated daily on week days.
Initial download of the metrics may take a while.