Fig. A.2.
Download original image
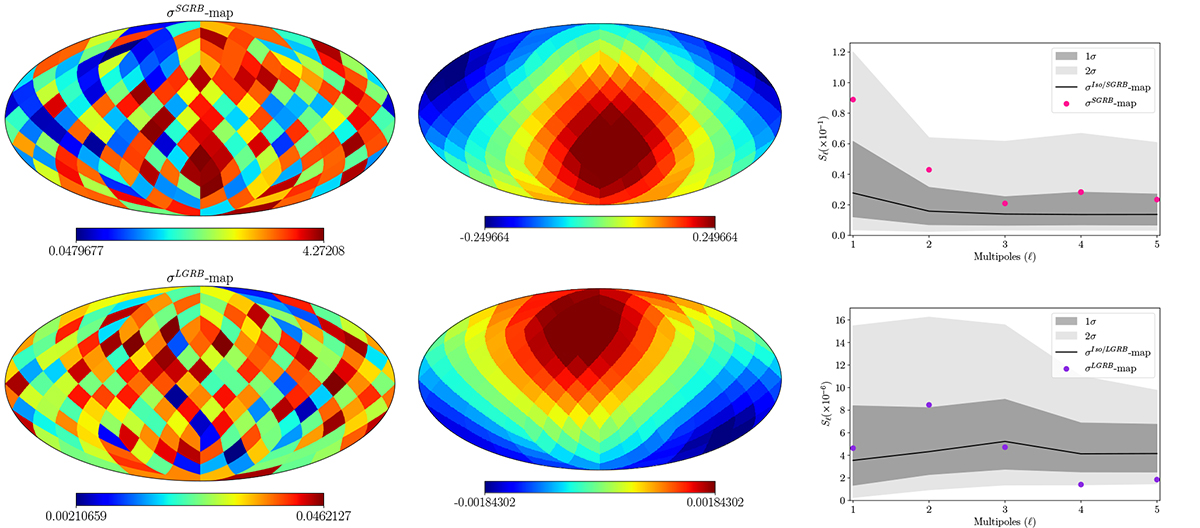
Directional analysis of the GRBs angular correlations: SGRB and LGRB cases. The first/second row corresponds to the SGRB/LGRB angular distribution analyses. Left panel:σSGRB/LGRB-map obtained from the directional analyses of the SGRB and LGRB samples. Middle panel: Corresponding dipole component of the σSGRB/LGRB-map. Right panel: Power spectrum ![]() , ℓ = 1, ..., 5 of the σSGRB/LGRB-map shown as dots, and the median power spectrum of 500 isotropic σ-maps are shown on the solid line. The shaded region corresponds to 1 σ and 2 σ deviations from the isotropic case.
, ℓ = 1, ..., 5 of the σSGRB/LGRB-map shown as dots, and the median power spectrum of 500 isotropic σ-maps are shown on the solid line. The shaded region corresponds to 1 σ and 2 σ deviations from the isotropic case.
Current usage metrics show cumulative count of Article Views (full-text article views including HTML views, PDF and ePub downloads, according to the available data) and Abstracts Views on Vision4Press platform.
Data correspond to usage on the plateform after 2015. The current usage metrics is available 48-96 hours after online publication and is updated daily on week days.
Initial download of the metrics may take a while.