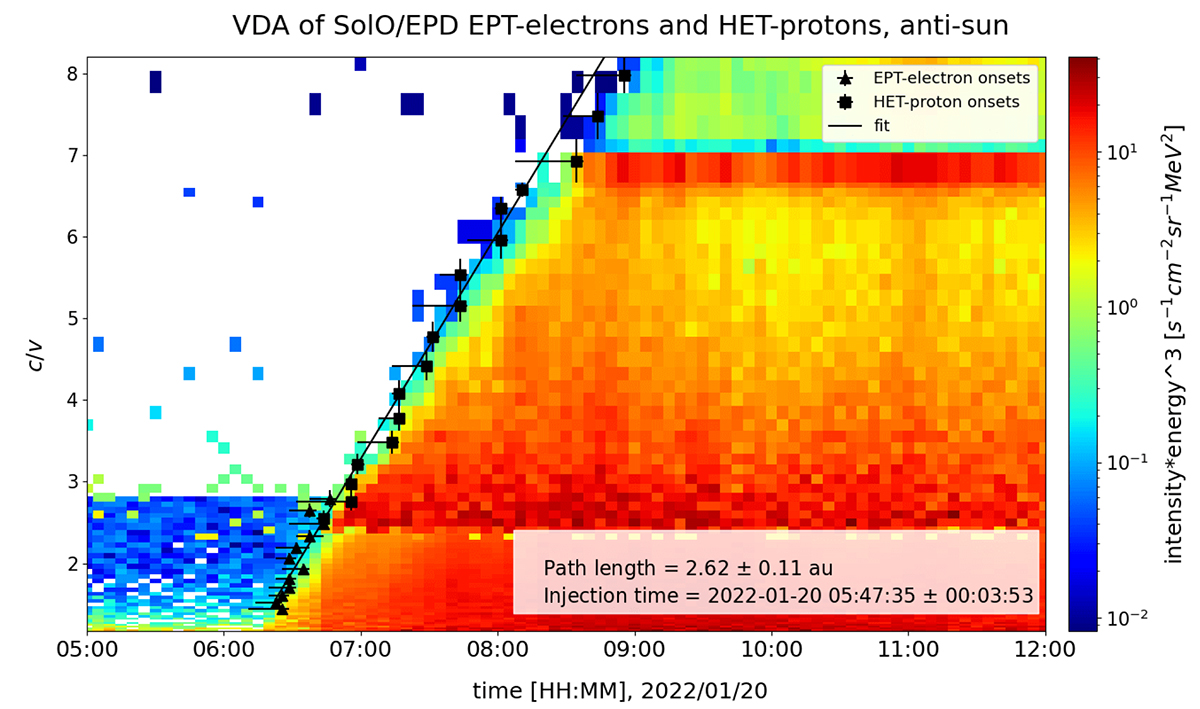
Fig. 9.
Download original image
Velocity dispersion analysis of the onset of the SEP event at Solar Orbiter. Electron and proton intensities (colour-coded) from EPT and HET sensors, respectively, as function of time and inverse speed (c/v which is 1/β as used in Fig. 8). The colour-coded intensities are multiplied by the cubed energy to enhance the contrast. Over-plotted in black are the onsets of electrons (triangles) and protons (squares), and the velocity dispersion fitted line. The path length and injection time values shown in the legend are the result from bootstrapping (details given in the main text).
Current usage metrics show cumulative count of Article Views (full-text article views including HTML views, PDF and ePub downloads, according to the available data) and Abstracts Views on Vision4Press platform.
Data correspond to usage on the plateform after 2015. The current usage metrics is available 48-96 hours after online publication and is updated daily on week days.
Initial download of the metrics may take a while.