Fig. 3.
Download original image
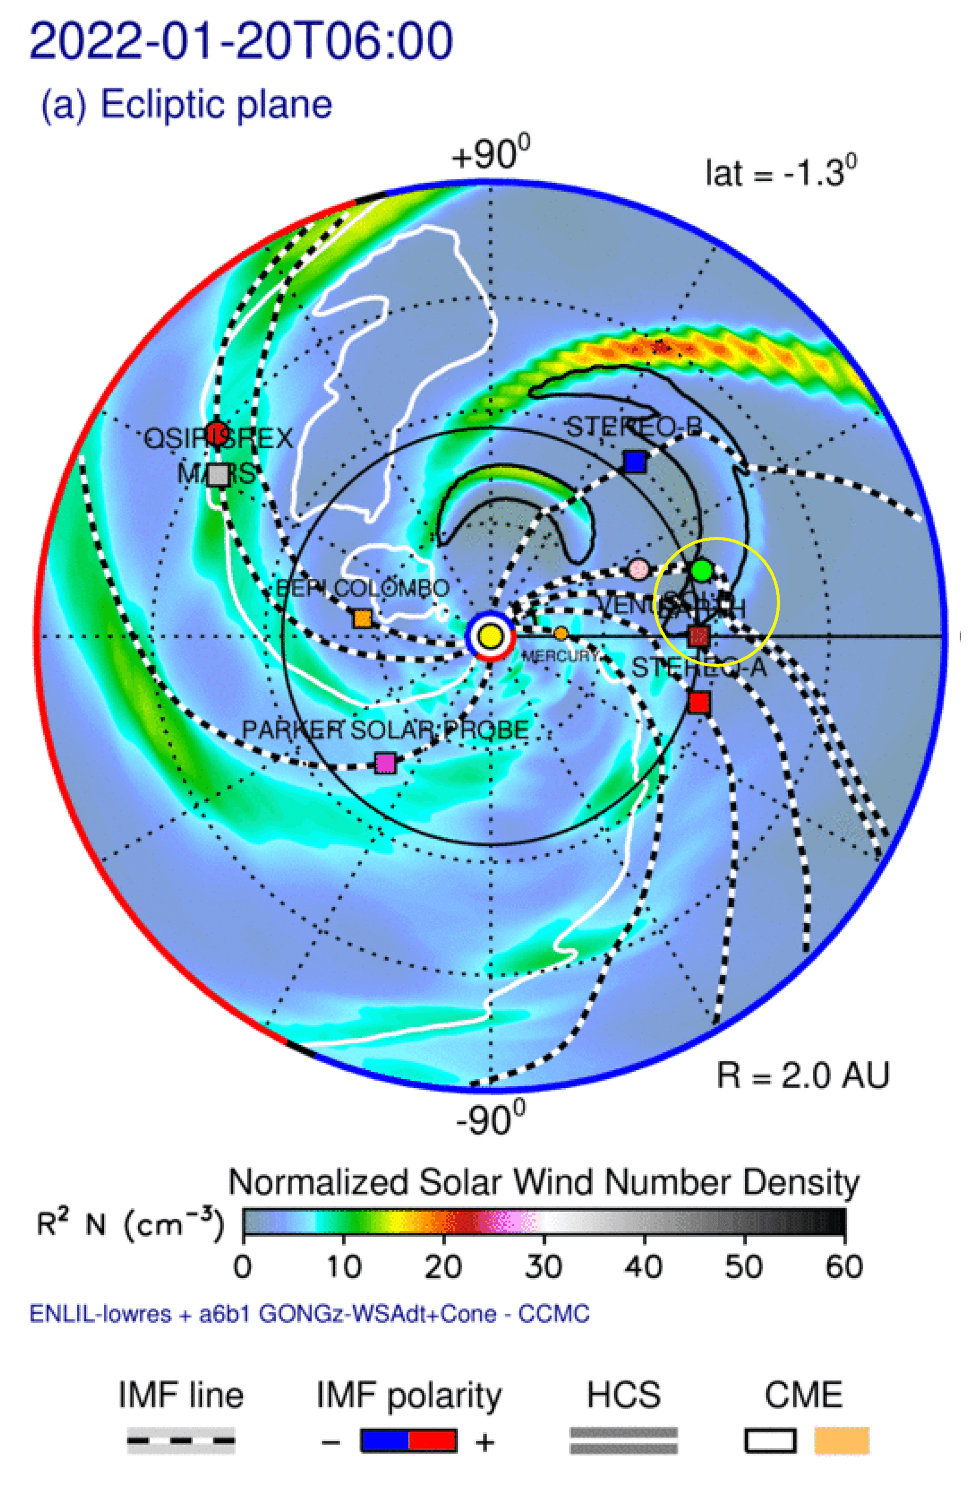
Snapshot of the radially scaled solar wind density from the ENLIL simulation in the ecliptic plane at 06:00 UT on 2022 January 20. The black and white dashed lines represent the IMF lines and the black contours track the ICMEs. The white lines correspond to the HCS, which separates the regions with opposite magnetic polarity, shown in blue (negative) or red (positive) on the outer edge of the simulation region. The yellow circle indicates the flank arrival of an ICME to Solar Orbiter (details given in the text). Credit: Community Coordinated Modeling Center (CCMC).
Current usage metrics show cumulative count of Article Views (full-text article views including HTML views, PDF and ePub downloads, according to the available data) and Abstracts Views on Vision4Press platform.
Data correspond to usage on the plateform after 2015. The current usage metrics is available 48-96 hours after online publication and is updated daily on week days.
Initial download of the metrics may take a while.