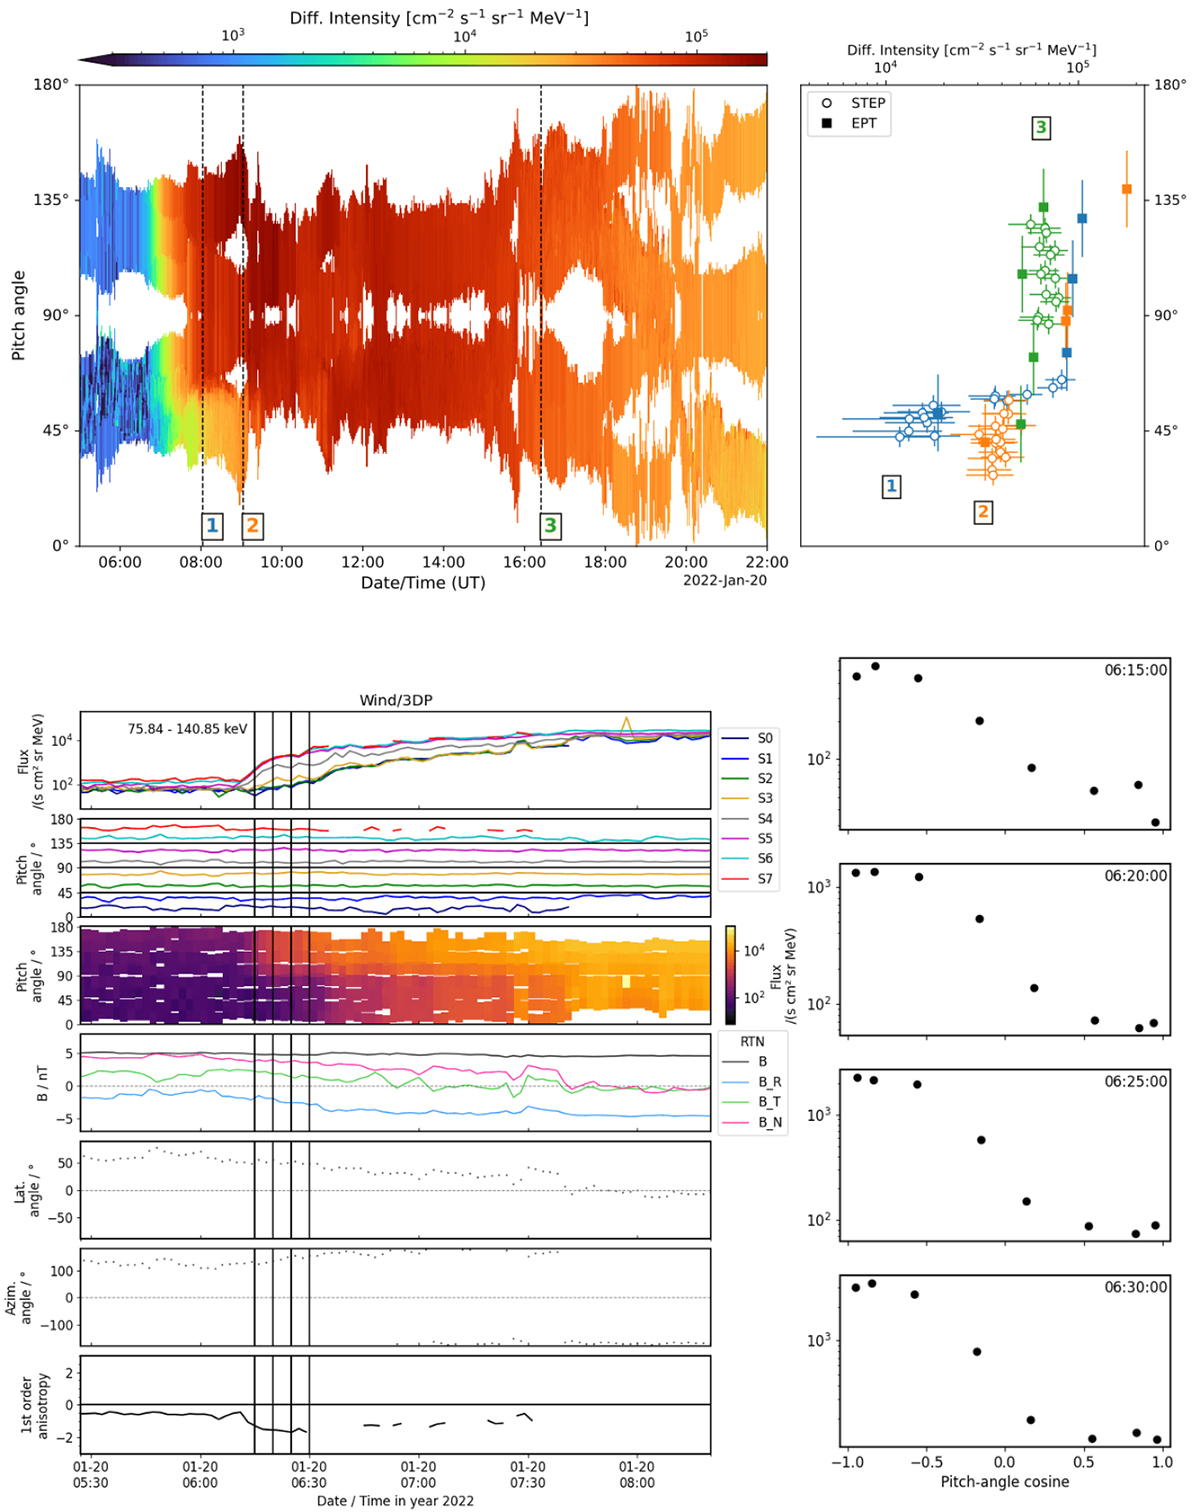
Fig. E.1.
Download original image
Pitch-angle space. Top: Reconstruction of the electron pitch-angle distribution as observed by Solar Orbiter in the energy range of 30 to 50 keV, using data from EPT and STEP. The top-right panel shows three slices through the pitch-angle distribution at different times during the event, indicated by labels 1, 2 and 3 on the top-left panel. EPT and STEP measurements are represented by filled squares and empty circles, respectively. Bottom: Left from top to bottom: electron intensity in the eight sectors of Wind/3DP, corresponding pitch angles of the bin centres, combined pitch-angle distribution with electron intensities marked by colour-coding, magnetic field magnitude and RTN-components, magnetic field latitudinal and azimuthal angles, and first-order anisotropy. Right: 2-dimensional pitch-angle distributions at the times marked by vertical lines in the plot on the left.
Current usage metrics show cumulative count of Article Views (full-text article views including HTML views, PDF and ePub downloads, according to the available data) and Abstracts Views on Vision4Press platform.
Data correspond to usage on the plateform after 2015. The current usage metrics is available 48-96 hours after online publication and is updated daily on week days.
Initial download of the metrics may take a while.