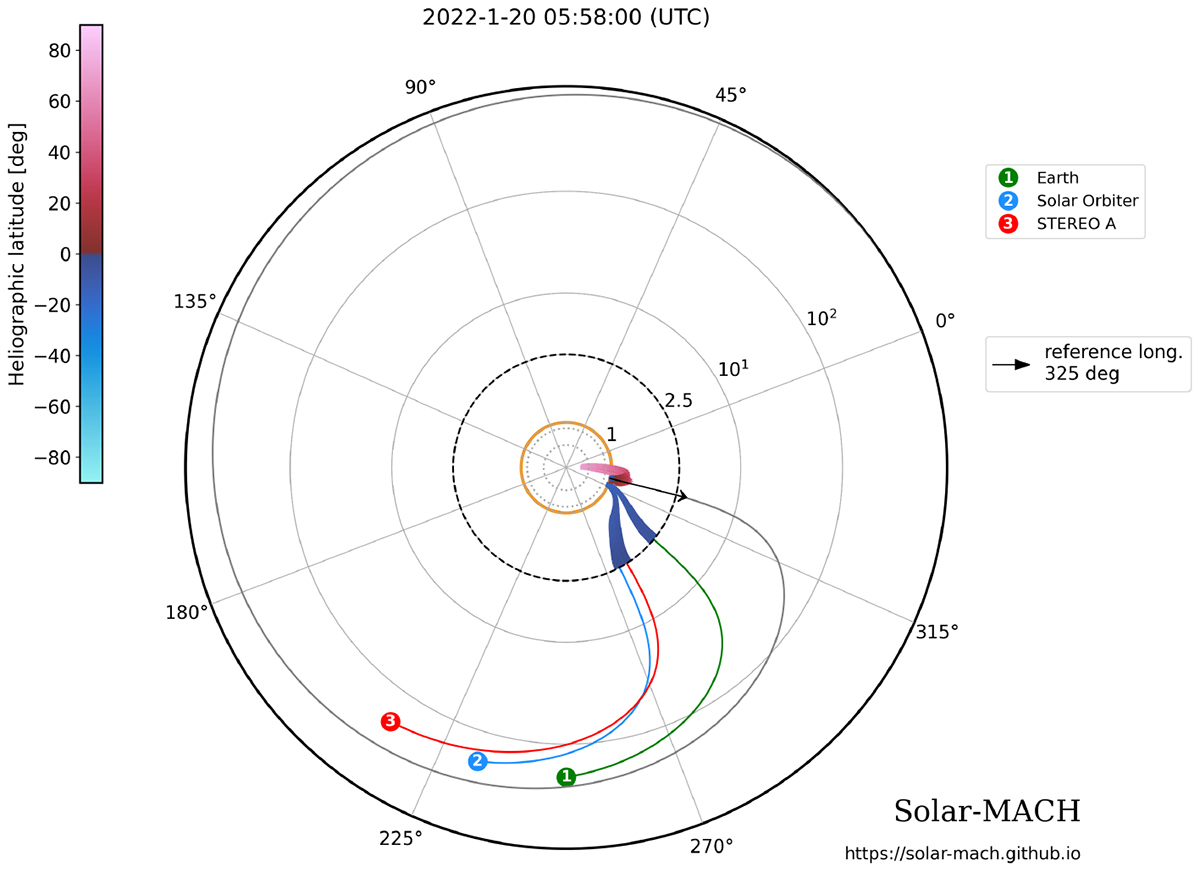
Fig. 2.
Download original image
Semi-logarithmic representation of the spacecraft constellation in the Carrington coordinate system at 05:58 UT on 2022 January 20. The orange circle at the centre indicates the Sun and the black arrow corresponds to the flare location. Colour-coded solid circles mark the various spacecraft of the constellation, and the lines connected to them represent the nominal Parker spiral solutions calculated using their heliocentric distances and the observed solar wind speeds. The potential field source surface (at 2.5 R⊙ in this case), which is the outer boundary of the potential-field model, is shown with the dashed circle. Below the source surface the magnetic field lines are extrapolated using a PFSS model, where the colour of the lines corresponds to heliospheric latitude. The reddish closed lines around the flare location are also given by the PFSS model. Below the source surface the plot is linear and above it is logarithmic in distance.
Current usage metrics show cumulative count of Article Views (full-text article views including HTML views, PDF and ePub downloads, according to the available data) and Abstracts Views on Vision4Press platform.
Data correspond to usage on the plateform after 2015. The current usage metrics is available 48-96 hours after online publication and is updated daily on week days.
Initial download of the metrics may take a while.