Fig. 14.
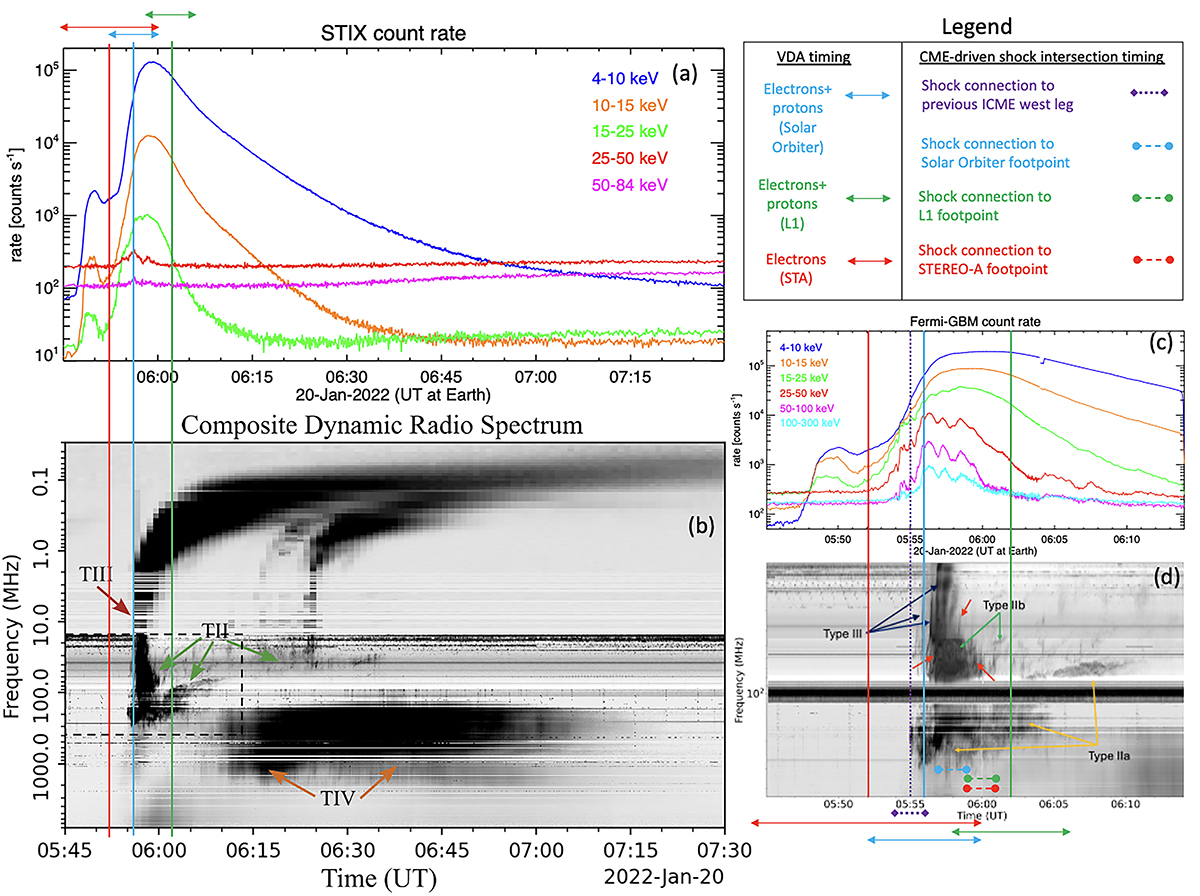
Download original image
Inferred SEP injection times shifted to 1 au (vertical lines with temporal error bars on top) overplotted on the radio spectrogram as observed from STEREO-A/WAVES and Earth (ASSA, and YAMAGAWA) and the X-ray count rates from Solar Orbiter/STIX. The zoom-in on the right corresponds to the dashed line square indicated on the left. It shows Fermi-GBM X-ray count rates against the same radio spectrogram. The STIX times have been shifted by 30 s for comparison with electromagnetic observations from 1 au. Legend on the top right refers to lines in panels (a), (b), and (c). The observed radio structures are indicated in panels b and c. Details given in the main text.
Current usage metrics show cumulative count of Article Views (full-text article views including HTML views, PDF and ePub downloads, according to the available data) and Abstracts Views on Vision4Press platform.
Data correspond to usage on the plateform after 2015. The current usage metrics is available 48-96 hours after online publication and is updated daily on week days.
Initial download of the metrics may take a while.