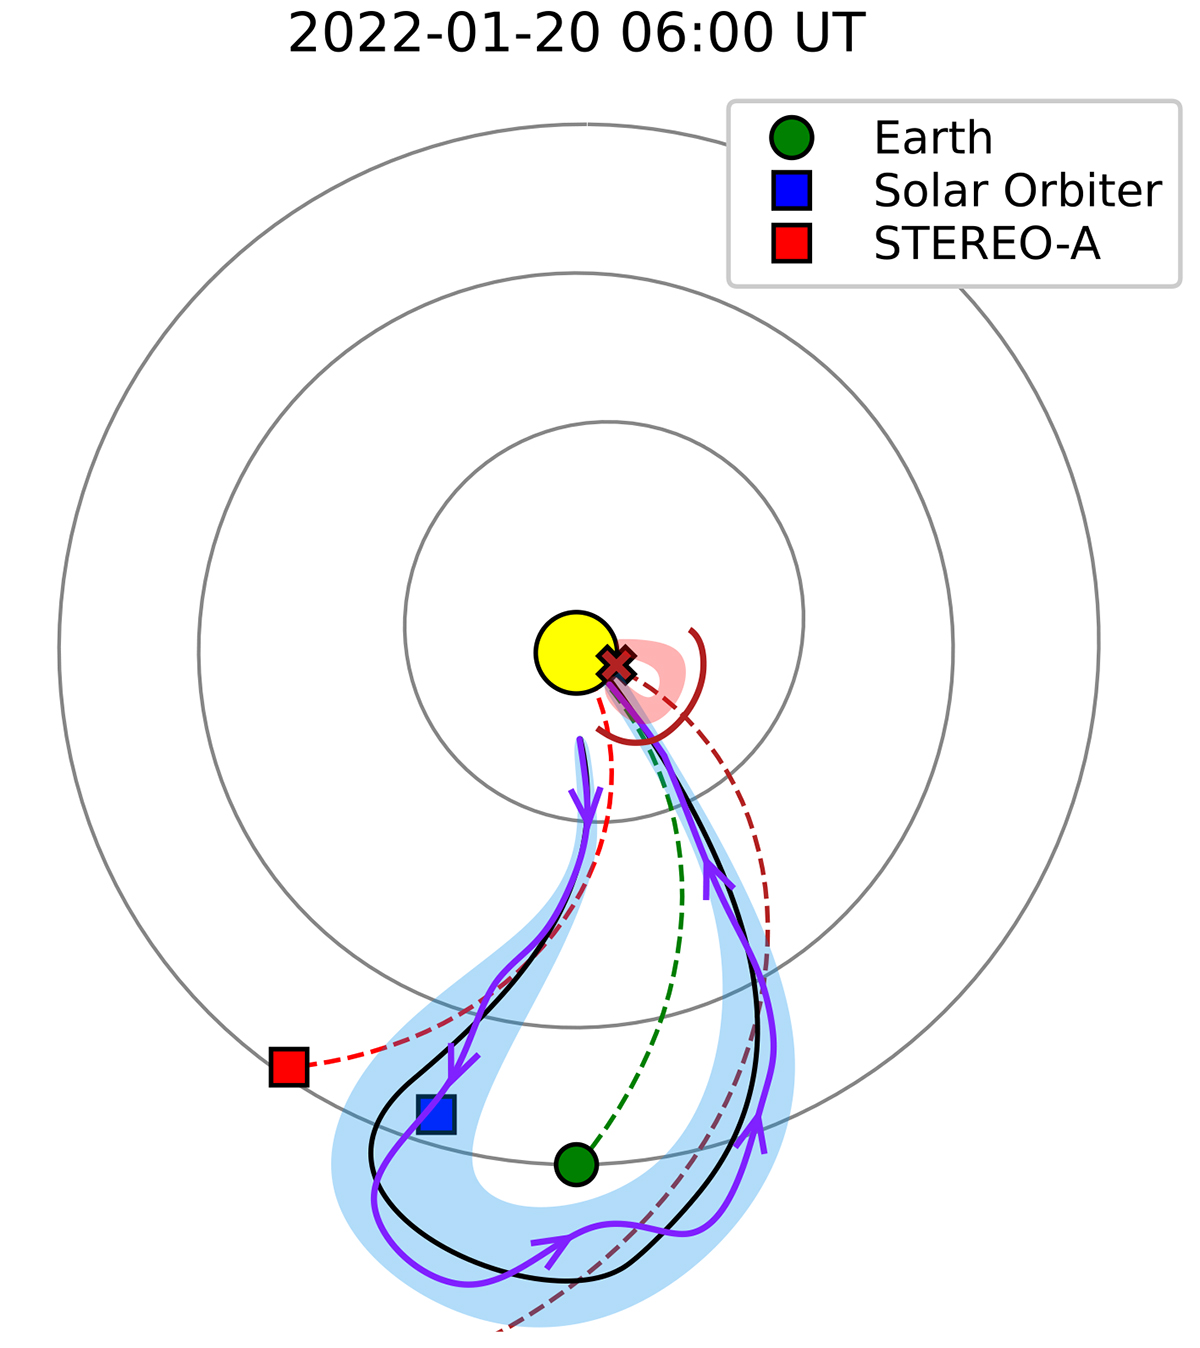
Fig. 13.
Download original image
Sketch showing interplanetary configuration of the 2022 January 20 SEP event. The Sun (not to scale) is shown at the centre indicated by the yellow circle. The grey circles represent, from the innermost outwards, the orbits of Mercury, Venus, and Earth. Earth, Solar Orbiter, and STEREO-A are shown by the green circle, blue, and red squares, respectively. The ICME corresponding to the CME erupting on 2022 January 16 is shown in blue. The CME and CME-driven shock associated with the SEP event on January 20 are indicated by the red shading and red curve, respectively. The dashed coloured lines indicate the nominal Parker spirals using measured solar wind speed. The rightmost dark-red dashed lines connects to the flare site using a nominal Parker spiral and 400 km s−1.
Current usage metrics show cumulative count of Article Views (full-text article views including HTML views, PDF and ePub downloads, according to the available data) and Abstracts Views on Vision4Press platform.
Data correspond to usage on the plateform after 2015. The current usage metrics is available 48-96 hours after online publication and is updated daily on week days.
Initial download of the metrics may take a while.