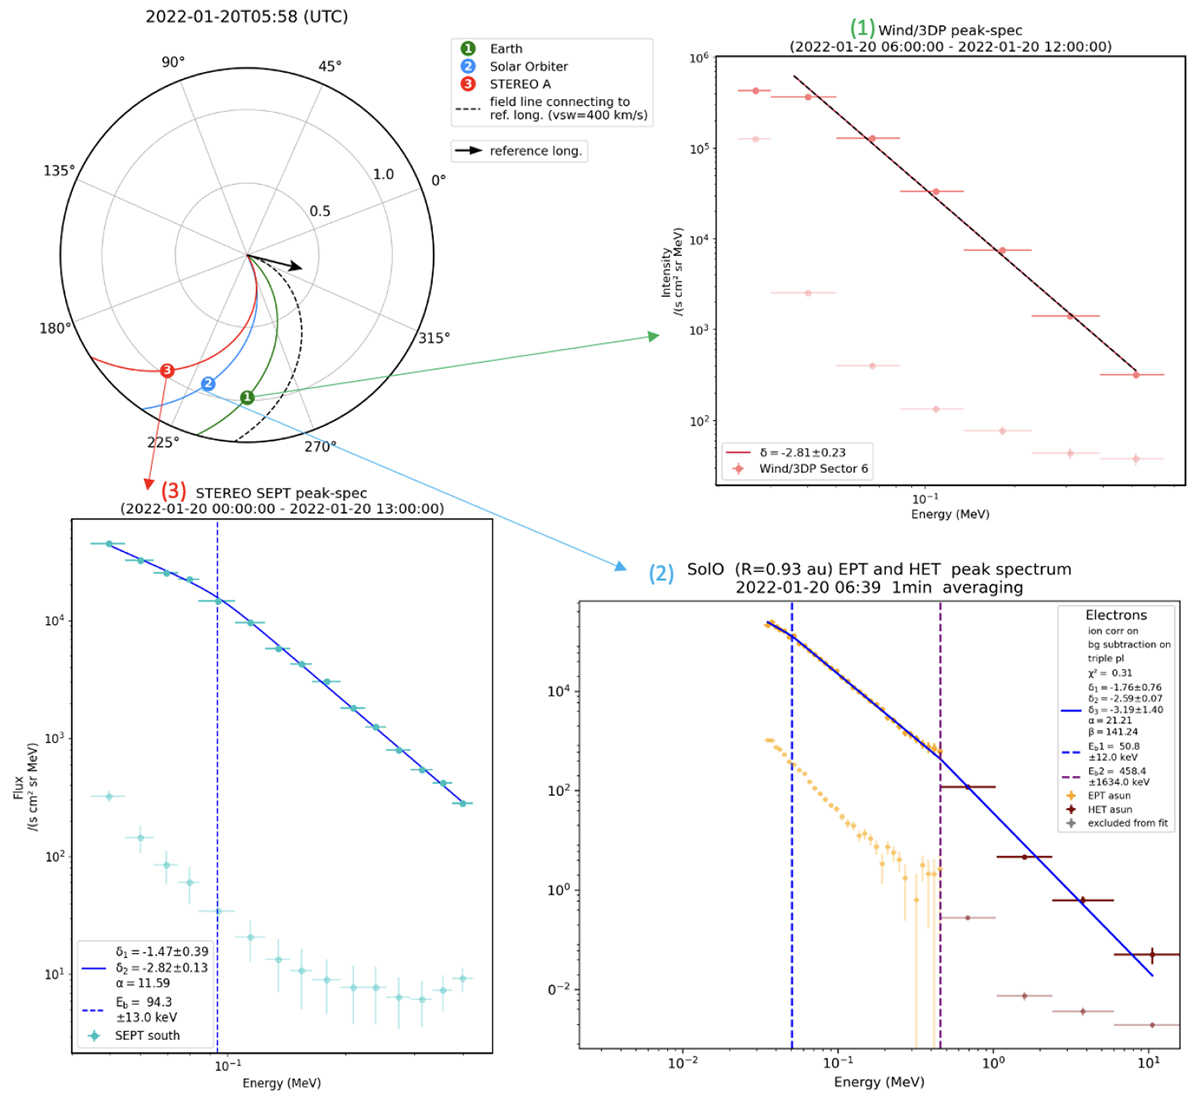
Fig. 12.
Download original image
Electron peak intensity spectra measured by Wind (1), Solar Orbiter (2), and STEREO-A (3). The legend shows the fit values: the spectral index (δ1, δ2δ3) observed in between the spectral transitions: Eb; and α (β), which determines the sharpness of the break(s) (Strauss et al. 2020). The lower and fainter set of points correspond to the pre-event background level. Details given in the main text.
Current usage metrics show cumulative count of Article Views (full-text article views including HTML views, PDF and ePub downloads, according to the available data) and Abstracts Views on Vision4Press platform.
Data correspond to usage on the plateform after 2015. The current usage metrics is available 48-96 hours after online publication and is updated daily on week days.
Initial download of the metrics may take a while.