Fig. 11.
Download original image
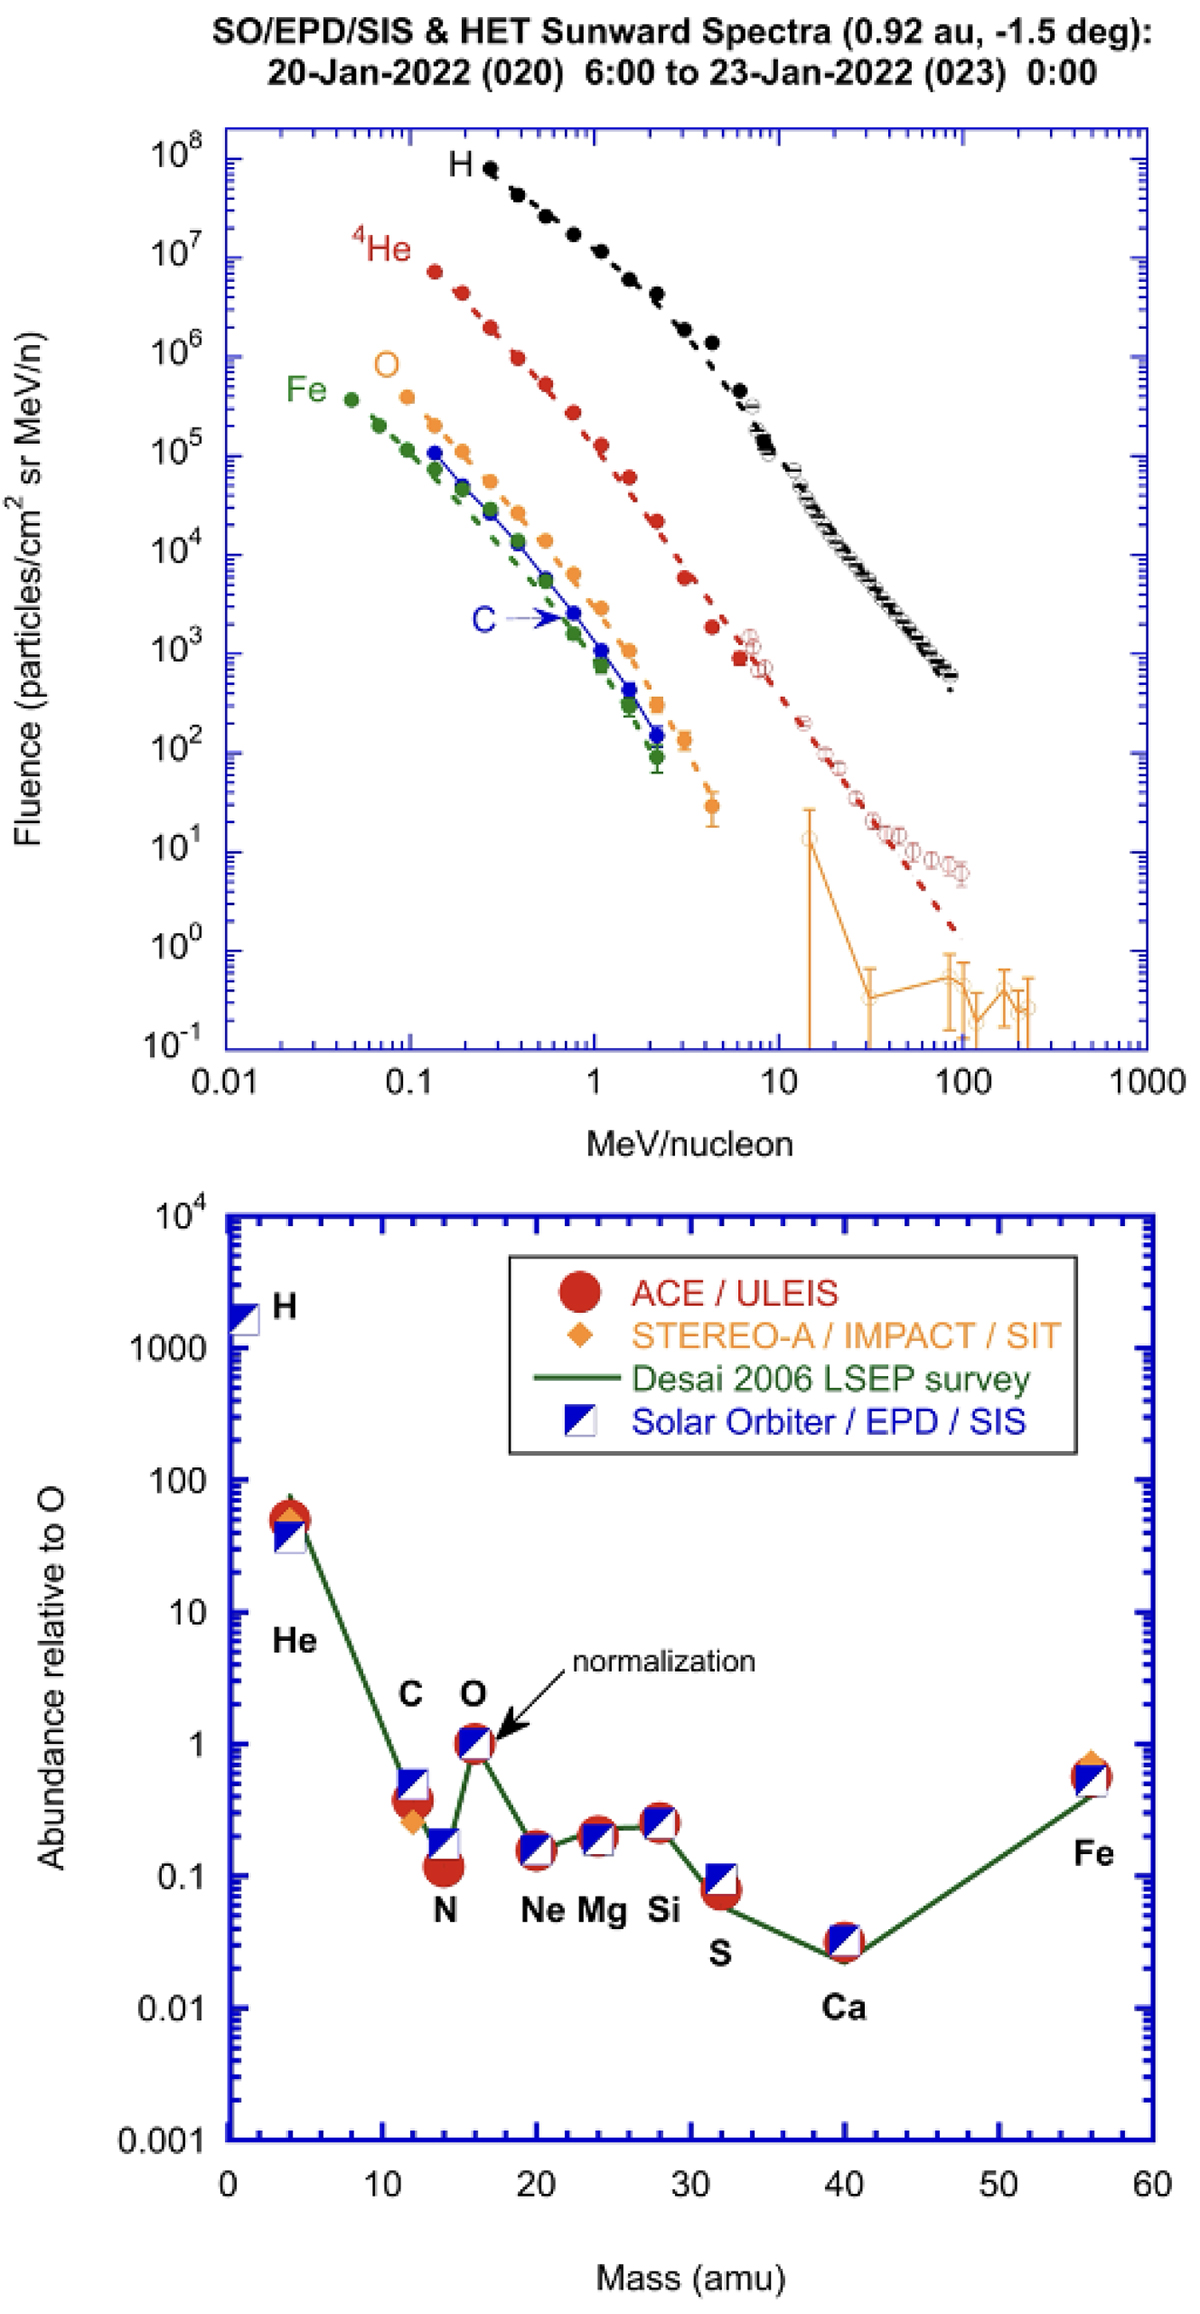
Solar energetic particle fluences and relative abundances. Top panel: Fluence spectra from SIS (filled circles) and HET (circles) summed over the event, and fitted Band function spectra (dotted lines). Bottom panel: Abundances from 0.32–0.45 MeV/nucleon for the 2022 January 20 event compared with averages at the same energy from the survey of 64 large SEP events by Desai et al. (2006). Blue half-filled squares are from Solar Orbiter SIS, filled red circles from ACE/ULEIS, and orange diamonds from STEREO-A/SIT.
Current usage metrics show cumulative count of Article Views (full-text article views including HTML views, PDF and ePub downloads, according to the available data) and Abstracts Views on Vision4Press platform.
Data correspond to usage on the plateform after 2015. The current usage metrics is available 48-96 hours after online publication and is updated daily on week days.
Initial download of the metrics may take a while.