Fig. 1.
Download original image
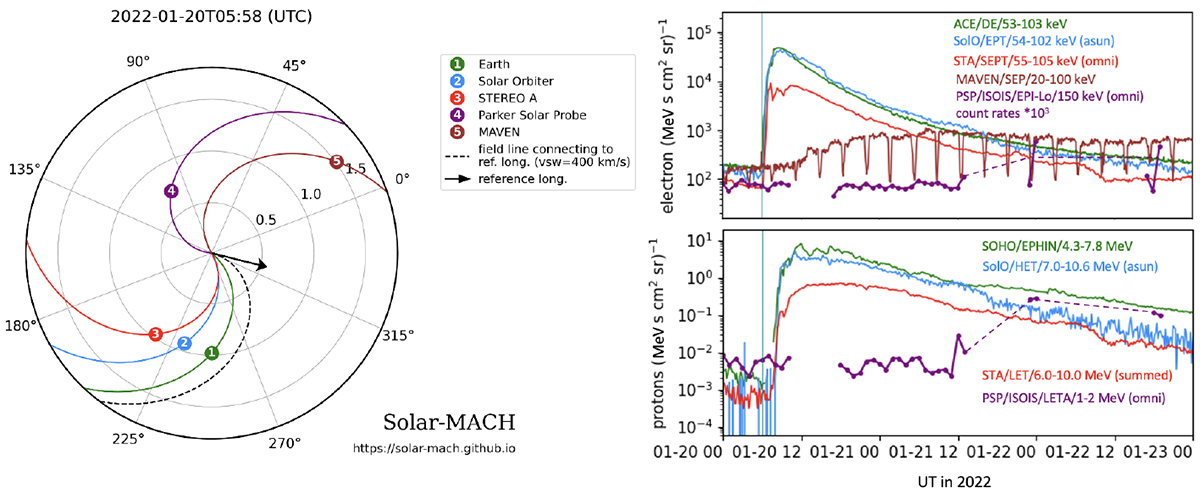
Longitudinal spacecraft constellation and magnetic connectivity at 05:58 UT on 2022 January 20 (left) along with multi-spacecraft SEP measurements (right). Left: Spacecraft configuration using the Solar-MACH tool (Gieseler et al. 2023), available online at https://doi.org/10.5281/zenodo.7100482. Right: The upper panel shows near-relativistic electron intensities and the lower panel ∼5 MeV proton intensities observed by the spacecraft indicated with the same colour code shown on the left panel. The blue vertical line indicates the time of the soft-X ray peak of the flare (∼05:58 UT) associated with the SEP event.
Current usage metrics show cumulative count of Article Views (full-text article views including HTML views, PDF and ePub downloads, according to the available data) and Abstracts Views on Vision4Press platform.
Data correspond to usage on the plateform after 2015. The current usage metrics is available 48-96 hours after online publication and is updated daily on week days.
Initial download of the metrics may take a while.