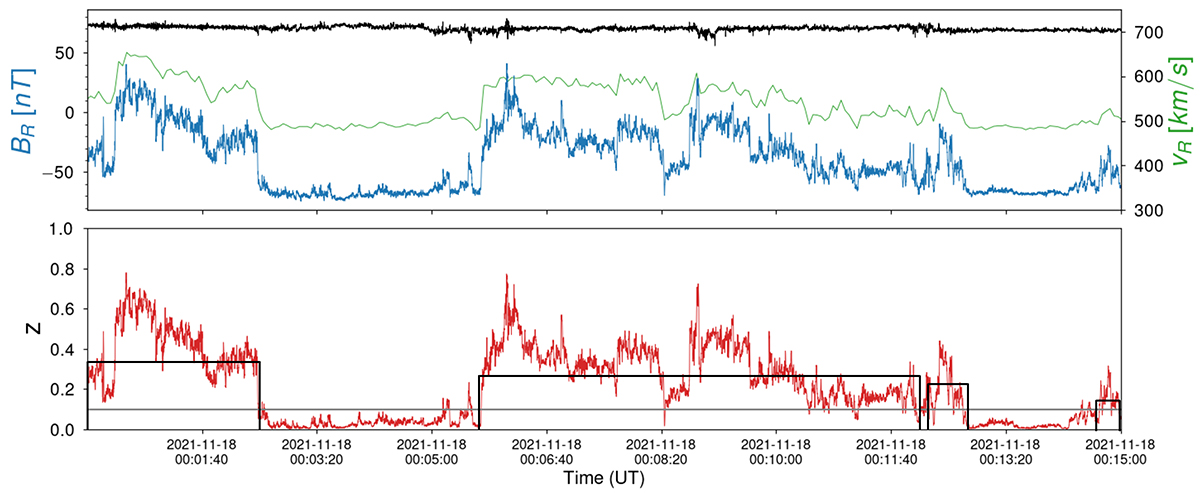
Fig. B.1.
Download original image
Example of a switchback interval. Their identification is indicated with the black rectangular shapes. Top: FIELDS/MAG magnetic field data and the proton velocity from SWEAP/SPAN-I, both in the R direction. Bottom: Normalized deflection, z. The overlapping rectangular shapes represent the structures included in this analysis that are sudden and/or sharp deflections.
Current usage metrics show cumulative count of Article Views (full-text article views including HTML views, PDF and ePub downloads, according to the available data) and Abstracts Views on Vision4Press platform.
Data correspond to usage on the plateform after 2015. The current usage metrics is available 48-96 hours after online publication and is updated daily on week days.
Initial download of the metrics may take a while.