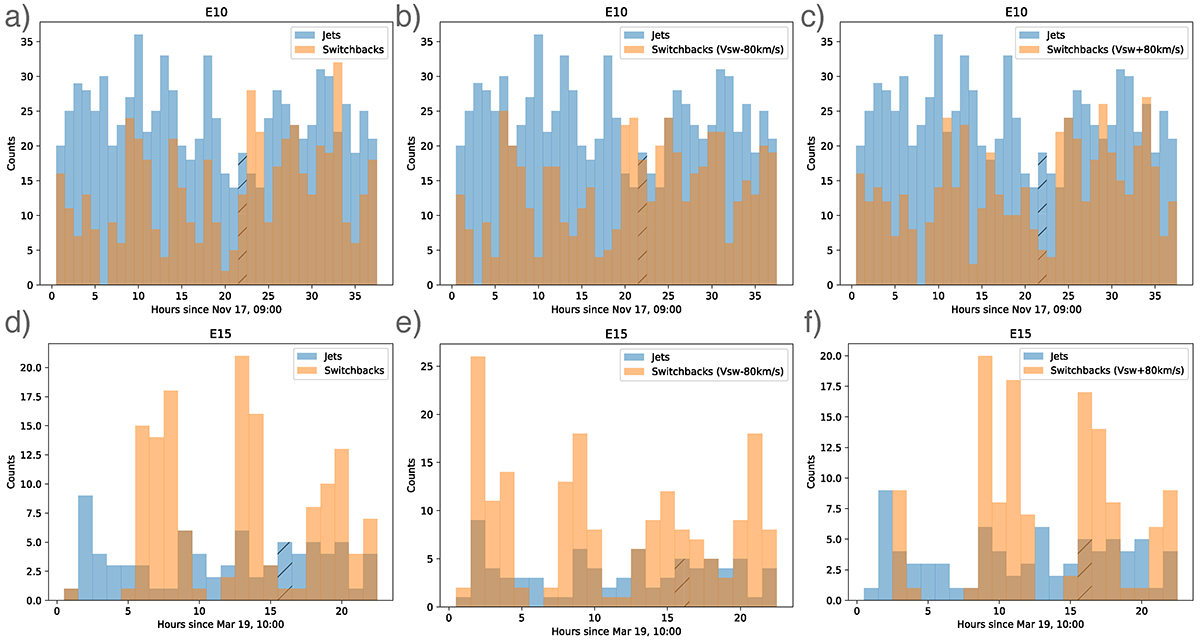
Fig. 3.
Download original image
Histogram of jet and switchback counts. The hourly counts of jets are shown in blue and the corresponding counts of switchbacks in orange. The reference time corresponds to the start of the jet-counting interval. (a): E10 counts with constant velocity. (b): E10 counts with acceleration correction. (c): E10 counts with acceleration correction and Alfvén velocity. Each switchback bin, which is equivalent to the 1 h interval of solar eruptions, corresponds to counts over 50 min. (d), (e), and (f): Same as panels (a), (b), and (c) but for E15. The hashed bins correspond to the counts in Figs. 1c and 2c, respectively. Each switchback bin, which is equivalent to the 1 h interval of CBP eruptions, corresponds to counts over 1h10m.
Current usage metrics show cumulative count of Article Views (full-text article views including HTML views, PDF and ePub downloads, according to the available data) and Abstracts Views on Vision4Press platform.
Data correspond to usage on the plateform after 2015. The current usage metrics is available 48-96 hours after online publication and is updated daily on week days.
Initial download of the metrics may take a while.