Fig. 1.
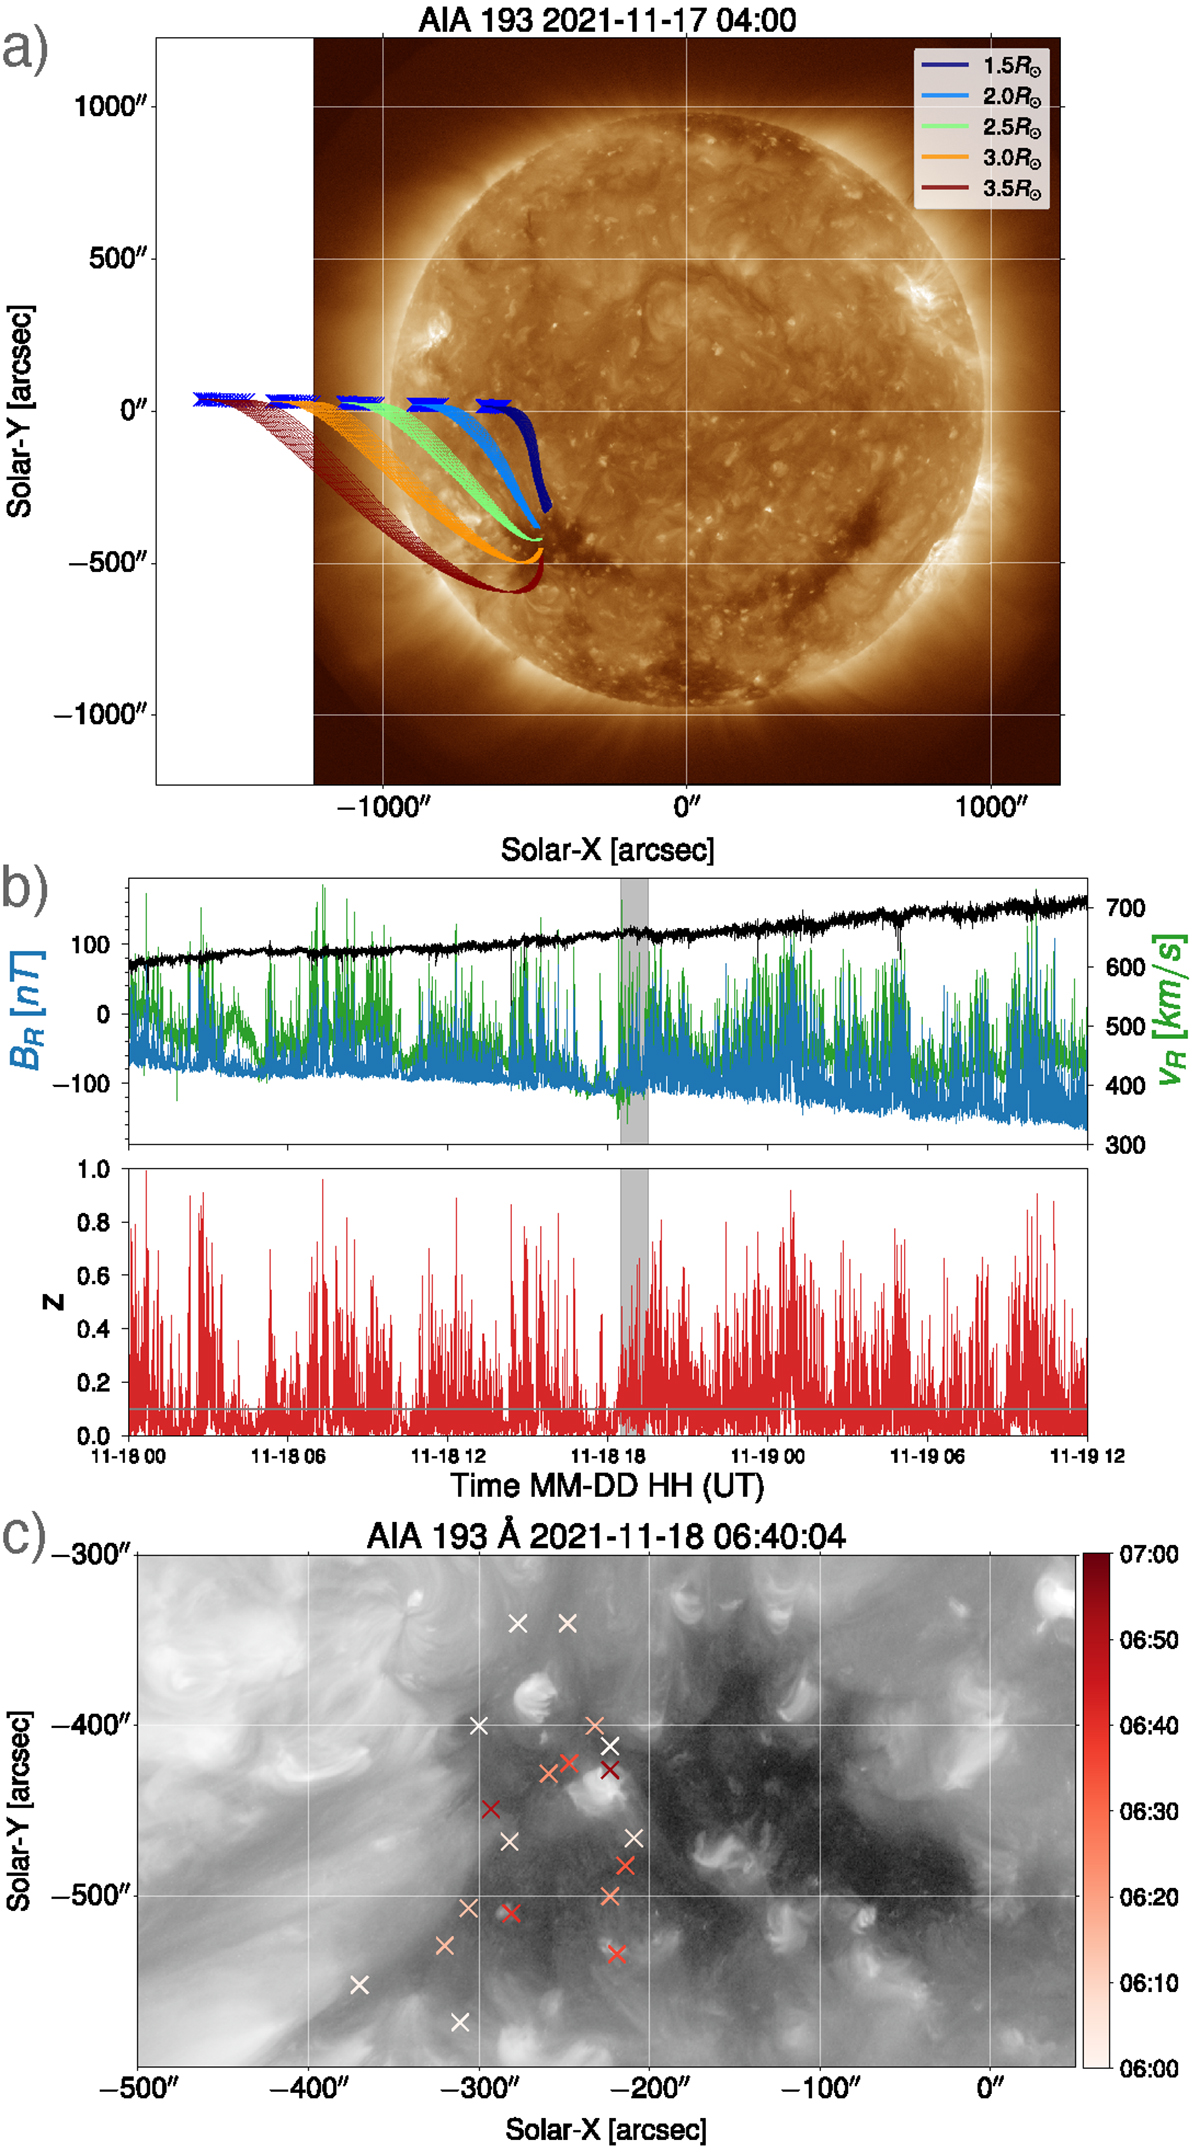
Download original image
E10 connectivities. (a): context AIA 193 image taken at the time of the computed extrapolation model. Colored magnetic field lines extracted from the PFSS model, computed at different source surface heights, are overplotted. The blue cross markers are the projection of PSP on the different source surfaces. The multiple blue field lines correspond to different velocities. All field lines are rooted in the same equatorial CH. (b): in situ PSP data for E10 for a constant Carrington longitude. The z parameter corresponds to the normalized deflection from the Parker spiral. The gray horizontal line shows the lower threshold for the deflection angle. The gray vertical span corresponds to the time that matches the identification presented in panel (c), assuming propagation with constant velocity. (c): zoomed-in view of the CH connected to PSP during the entire corotating interval, with the jets detected during a 1-hour interval.
Current usage metrics show cumulative count of Article Views (full-text article views including HTML views, PDF and ePub downloads, according to the available data) and Abstracts Views on Vision4Press platform.
Data correspond to usage on the plateform after 2015. The current usage metrics is available 48-96 hours after online publication and is updated daily on week days.
Initial download of the metrics may take a while.