Fig. 3
Download original image
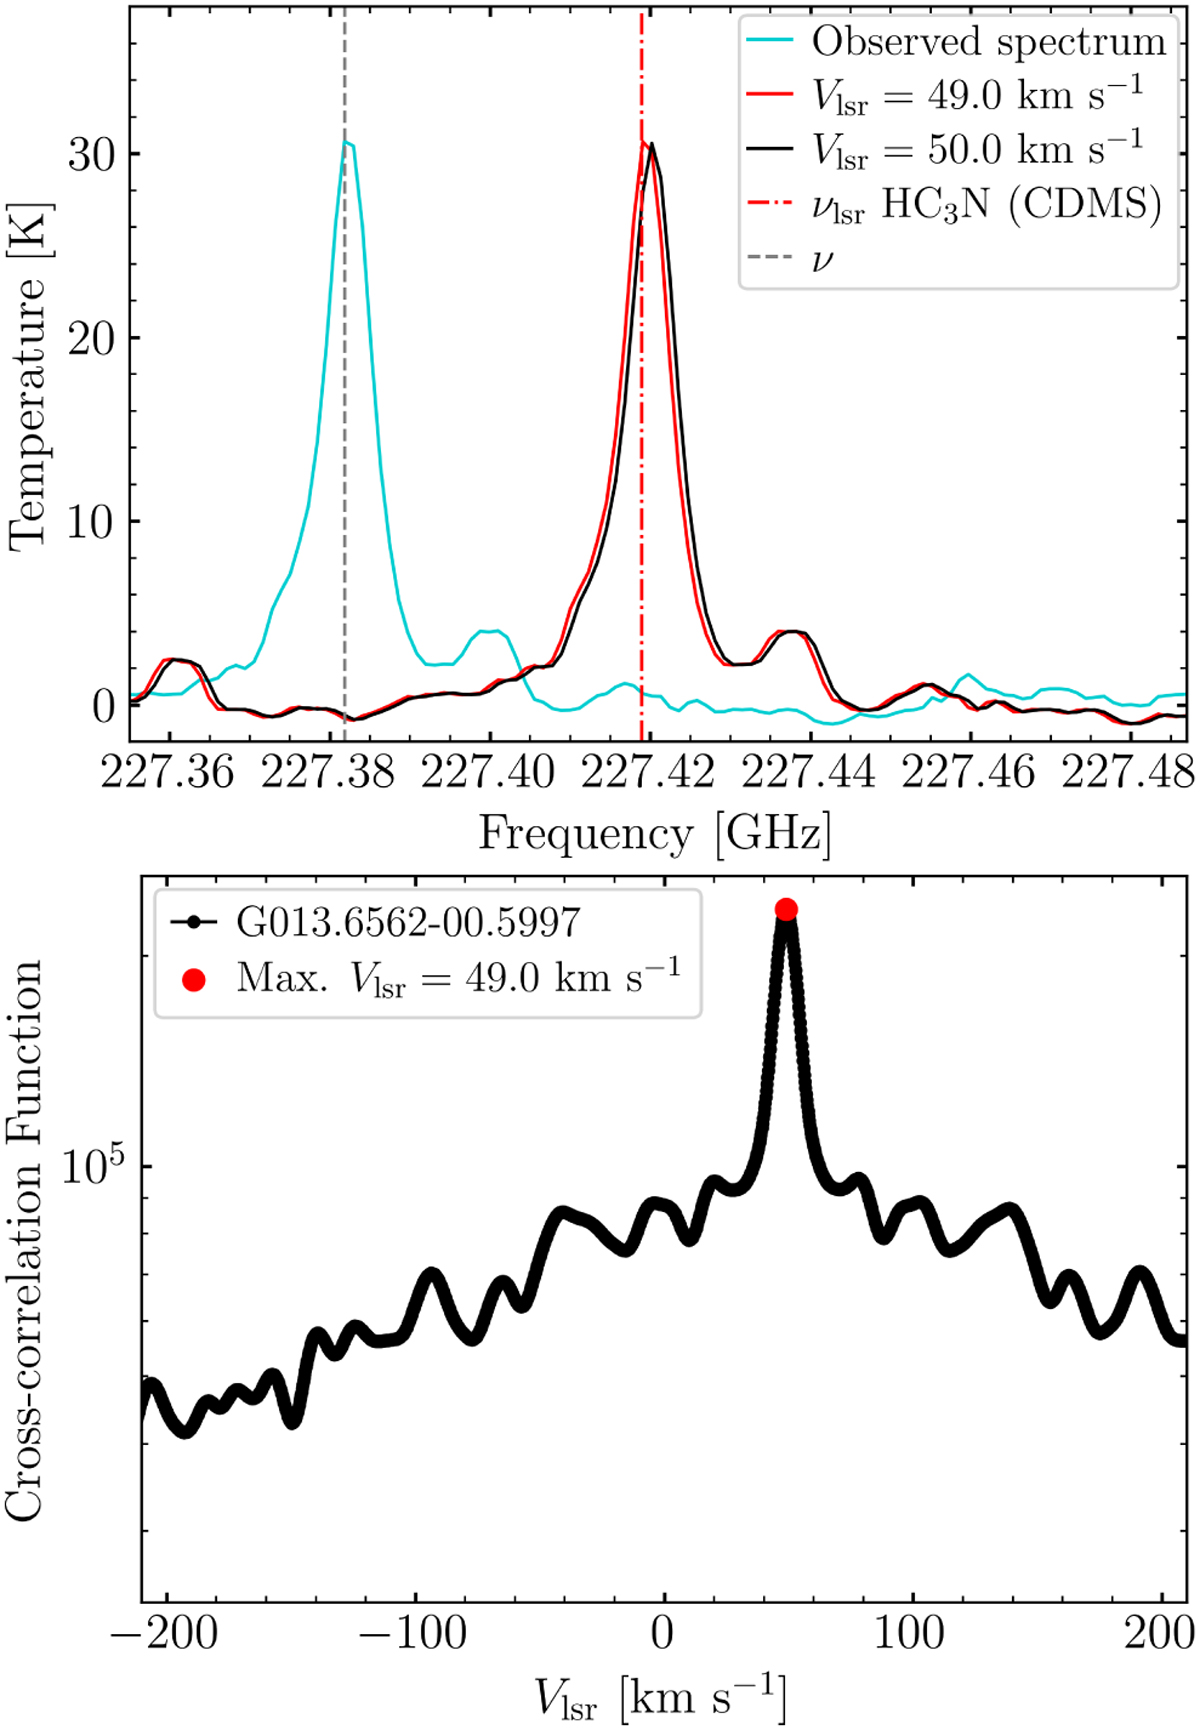
Line profile of HC3N (cyanoacetylene) emission in G013.6562-00.5997 with rest frequency νlsr = 227.41891 GHz (the vertical red dot-dashed line in the top panel). The turquoise curve is the observed line with central frequency marked by the vertical grey dashed line. The black curve is the line corrected by Vlsr = 50.0 km s−1 (Lumsden et al. 2013; Frimpong 2021). The red curve is the line corrected by Vlsr = 49.0 km s−1. The bottom panel shows the cross-correlation function of the same source maximized at Vlsr = 49.0 km s−1.
Current usage metrics show cumulative count of Article Views (full-text article views including HTML views, PDF and ePub downloads, according to the available data) and Abstracts Views on Vision4Press platform.
Data correspond to usage on the plateform after 2015. The current usage metrics is available 48-96 hours after online publication and is updated daily on week days.
Initial download of the metrics may take a while.