Open Access
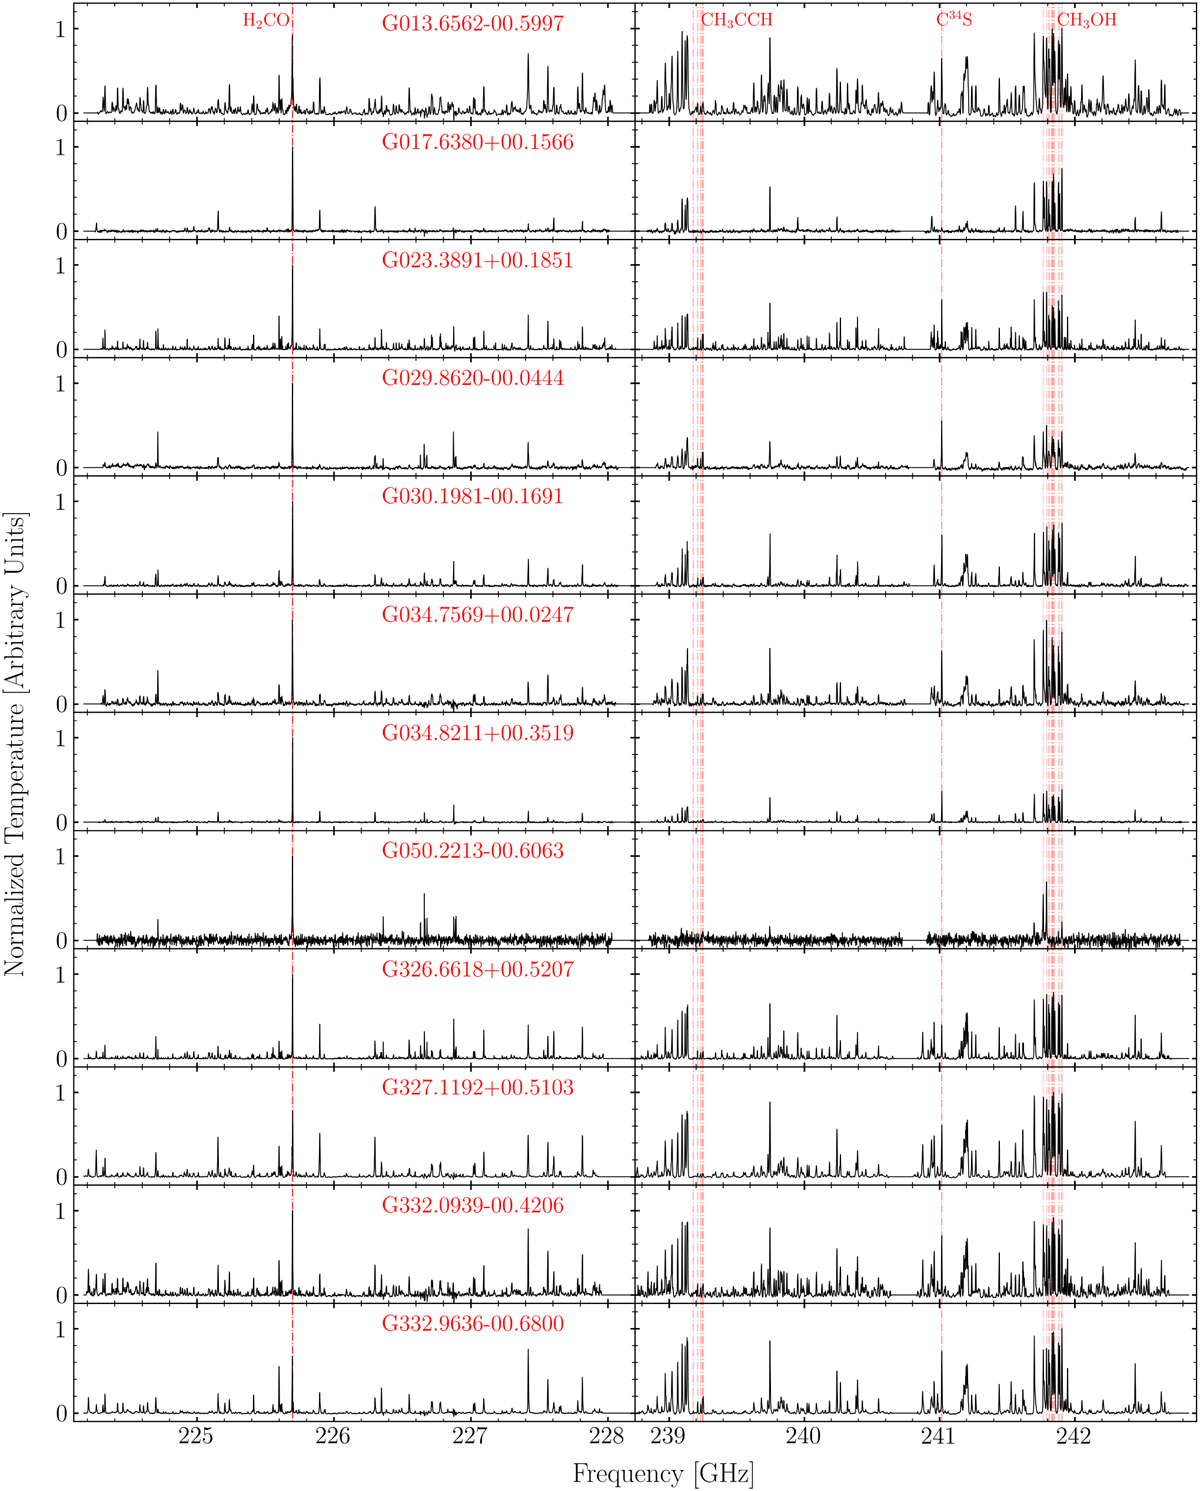
Fig. A.1
Download original image
Same as Fig. 4, but showing the complete normalized spectral sample of 41 MYSOs. The vertical red lines indicate the emission lines used in the normalization (See Sect. 2.3.2 for more details).
This figure is made of several images, please see below:
Current usage metrics show cumulative count of Article Views (full-text article views including HTML views, PDF and ePub downloads, according to the available data) and Abstracts Views on Vision4Press platform.
Data correspond to usage on the plateform after 2015. The current usage metrics is available 48-96 hours after online publication and is updated daily on week days.
Initial download of the metrics may take a while.