Open Access
Fig. 8.
Download original image
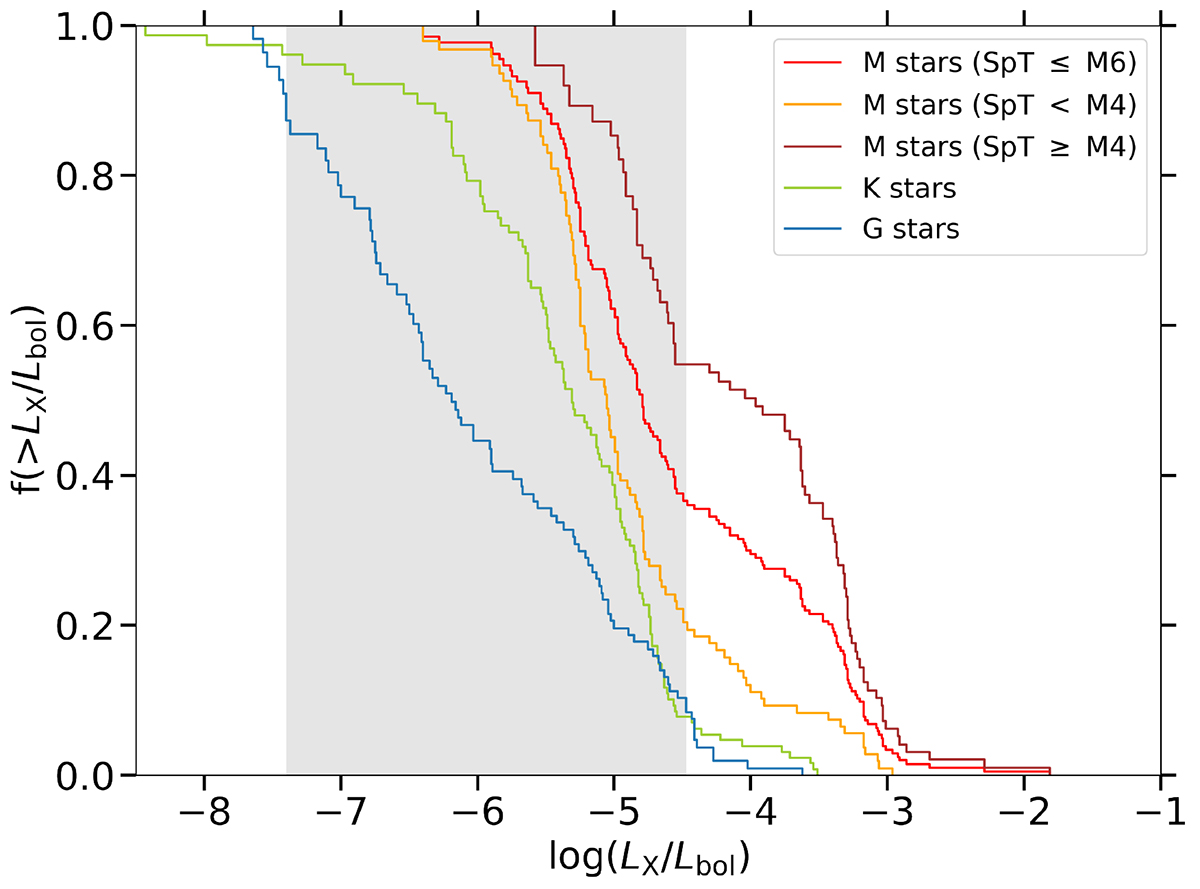
Comparison of the Kaplan-Meier estimators for the log(LX/Lbol) distributions of G, K, and M stars in this work. Distributions for late and early M stars are also plotted. The central 80% quantile of G stars is shaded in gray.
Current usage metrics show cumulative count of Article Views (full-text article views including HTML views, PDF and ePub downloads, according to the available data) and Abstracts Views on Vision4Press platform.
Data correspond to usage on the plateform after 2015. The current usage metrics is available 48-96 hours after online publication and is updated daily on week days.
Initial download of the metrics may take a while.