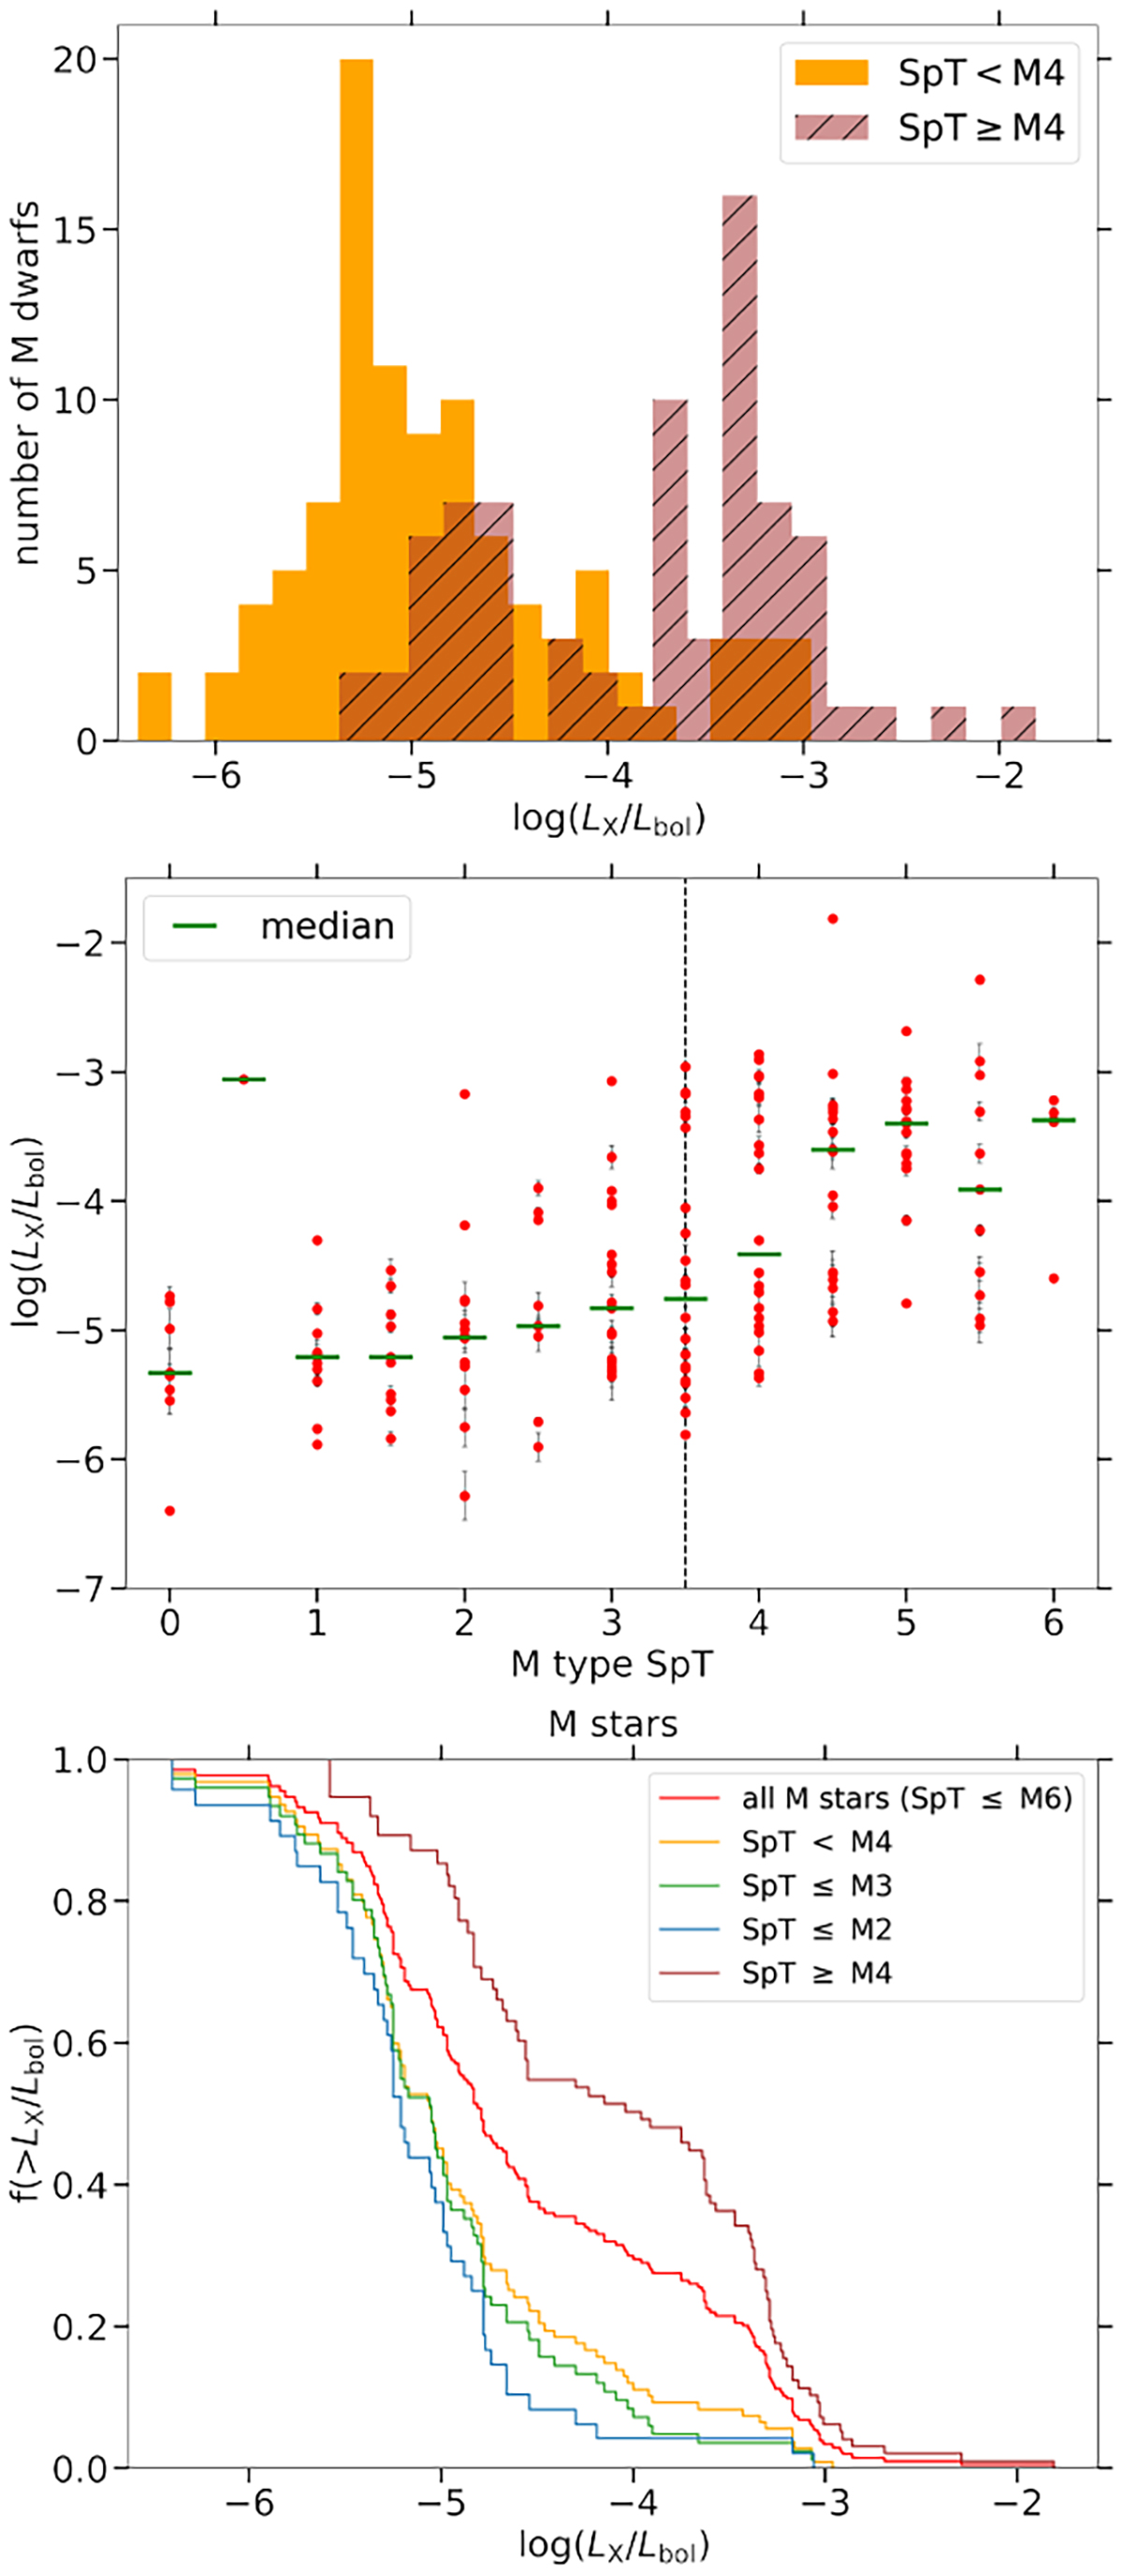
Fig. 7.
Download original image
The difference in X-ray activity between early and late M-type stars shown from different perspectives. Upper panel: Histogram of log(LX/Lbol) of all X-ray detected M stars in our sample, separated into two subsamples with SpT ≤ M4 and > M4. Middle panel: log(LX/Lbol) of all X-ray detected M stars are plotted against spectral subtype. The median value of each subtype is shown with a horizontal green line. A vertical dashed line is drawn at SpT M3.5. Lower panel: Kaplan-Meier estimator for the distributions of log(LX/Lbol) for all M stars in our sample and of different subsamples based on their SpT.
Current usage metrics show cumulative count of Article Views (full-text article views including HTML views, PDF and ePub downloads, according to the available data) and Abstracts Views on Vision4Press platform.
Data correspond to usage on the plateform after 2015. The current usage metrics is available 48-96 hours after online publication and is updated daily on week days.
Initial download of the metrics may take a while.