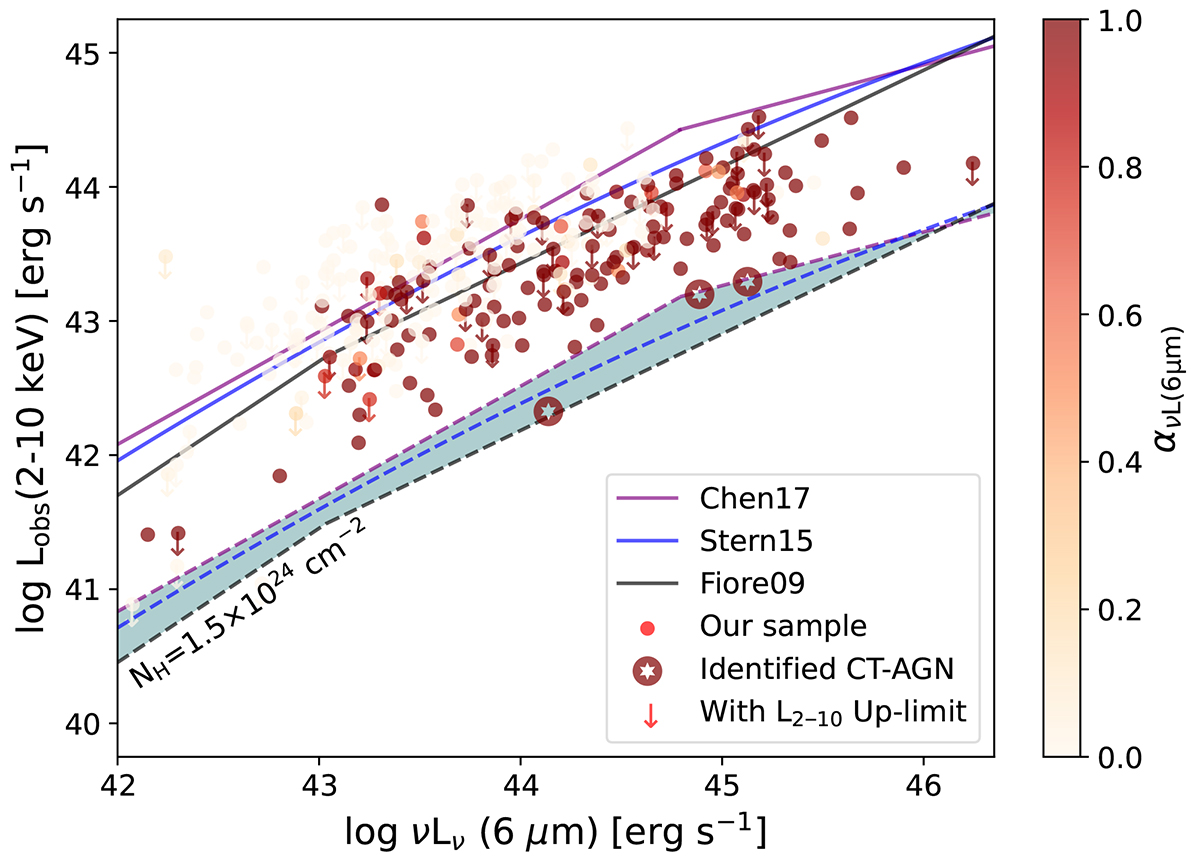
Fig. 3.
Download original image
Observed X-ray luminosity in the rest-frame 2–10 keV band as a function of the 6 μm luminosity for fit AGN component. The solid purple, blue, and black lines represent the relation for Chen et al. (2017), Stern (2015), and Fiore et al. (2009), respectively. The dashed lines indicate the same relationships but where the X-ray luminosities are absorbed by a column density of NH = 1.5 × 1024 cm−2. The shaded area represents the column density of absorbed gas is 1.5 × 1024 cm−2. The solid circles are 329 AGNs with a fit AGN component. The different colors represent the confidence coefficient of the 6 μm luminosity for a fit AGN component (or the fit AGN components). The cutting stars within the large circles represent CT-AGNs identified using the relationship between MIR and X-ray luminosities.
Current usage metrics show cumulative count of Article Views (full-text article views including HTML views, PDF and ePub downloads, according to the available data) and Abstracts Views on Vision4Press platform.
Data correspond to usage on the plateform after 2015. The current usage metrics is available 48-96 hours after online publication and is updated daily on week days.
Initial download of the metrics may take a while.