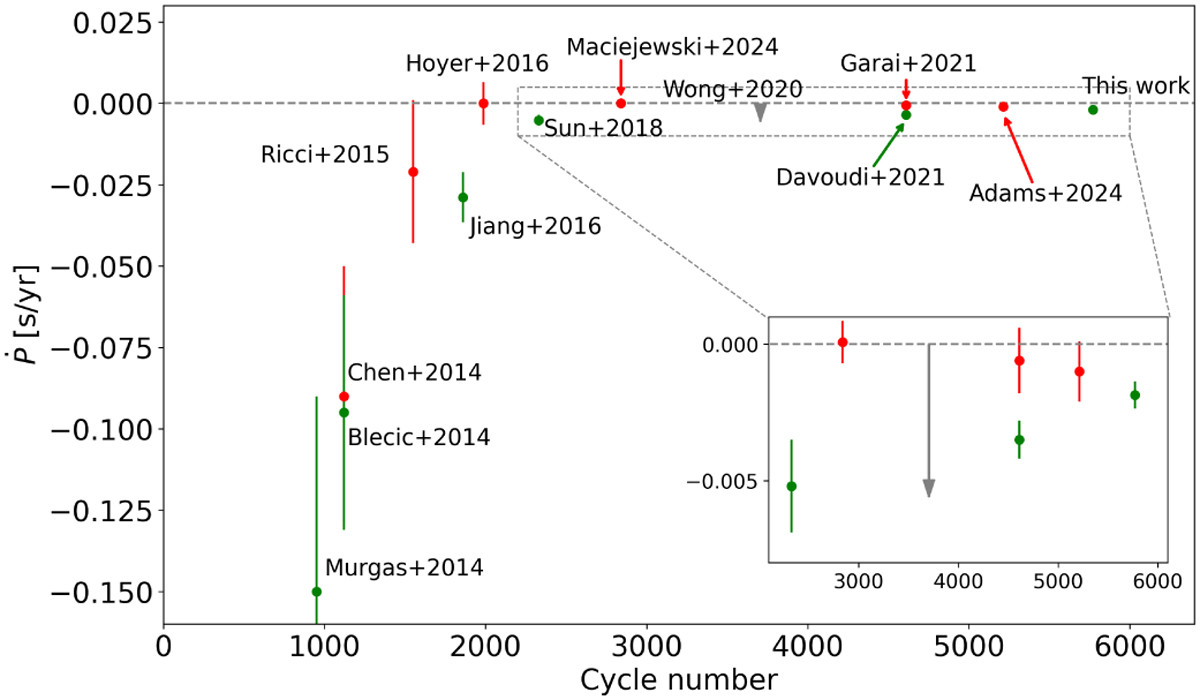
Fig. 5
Download original image
Literature retrievals of tidal decay rate and our results plotted as a function of cycle number starting from Hellier et al. (2011) as epoch zero. Non-detections are shown in red, detections are in green, and cases where there is only an upper limit are in grey. A zoom-in of the region between cycle numbers 2000 and 6000 is provided to show the small error bars of the latest studies. Our result is shown in green because even if BIC and AIC disfavour the tidal decay fit in comparison to the one- planet eccentric fit, in Section 3.6 we detect the same tidal decay rate, and this fit is the preferred one. The error bar on our value is particularly small because we fit TTVs and RVs simultaneously and because we make use of the longest dataset available.
Current usage metrics show cumulative count of Article Views (full-text article views including HTML views, PDF and ePub downloads, according to the available data) and Abstracts Views on Vision4Press platform.
Data correspond to usage on the plateform after 2015. The current usage metrics is available 48-96 hours after online publication and is updated daily on week days.
Initial download of the metrics may take a while.