Fig. 4
Download original image
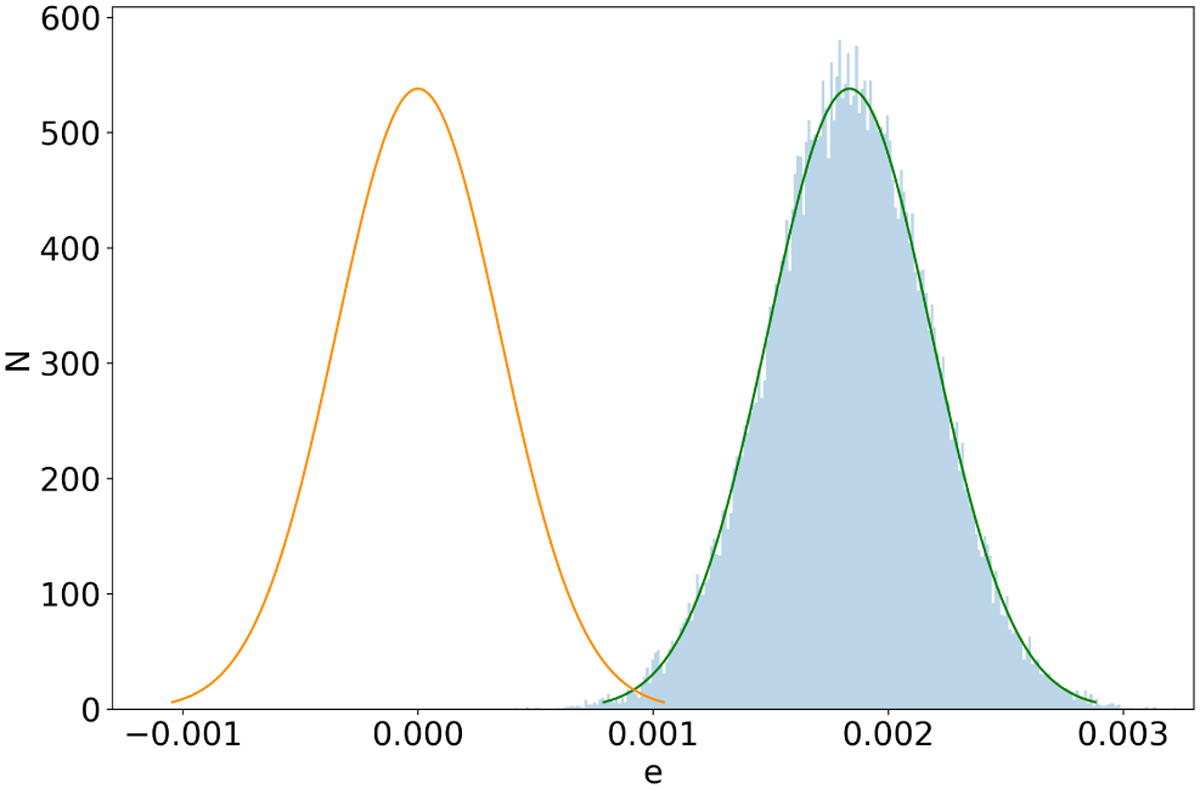
Eccentricity significance. The posterior distribution of the eccentricity is shown in blue. The normal distribution with µ = 0.00188 and σ = 0.00035 in blue is compared to a normal distribution with the same variance but shifted to have its mean at zero (orange curve). The spikes in the posterior distributions are highly investigated regions, such as local minima, where the chains were probably stuck before converging to the global minimum.
Current usage metrics show cumulative count of Article Views (full-text article views including HTML views, PDF and ePub downloads, according to the available data) and Abstracts Views on Vision4Press platform.
Data correspond to usage on the plateform after 2015. The current usage metrics is available 48-96 hours after online publication and is updated daily on week days.
Initial download of the metrics may take a while.