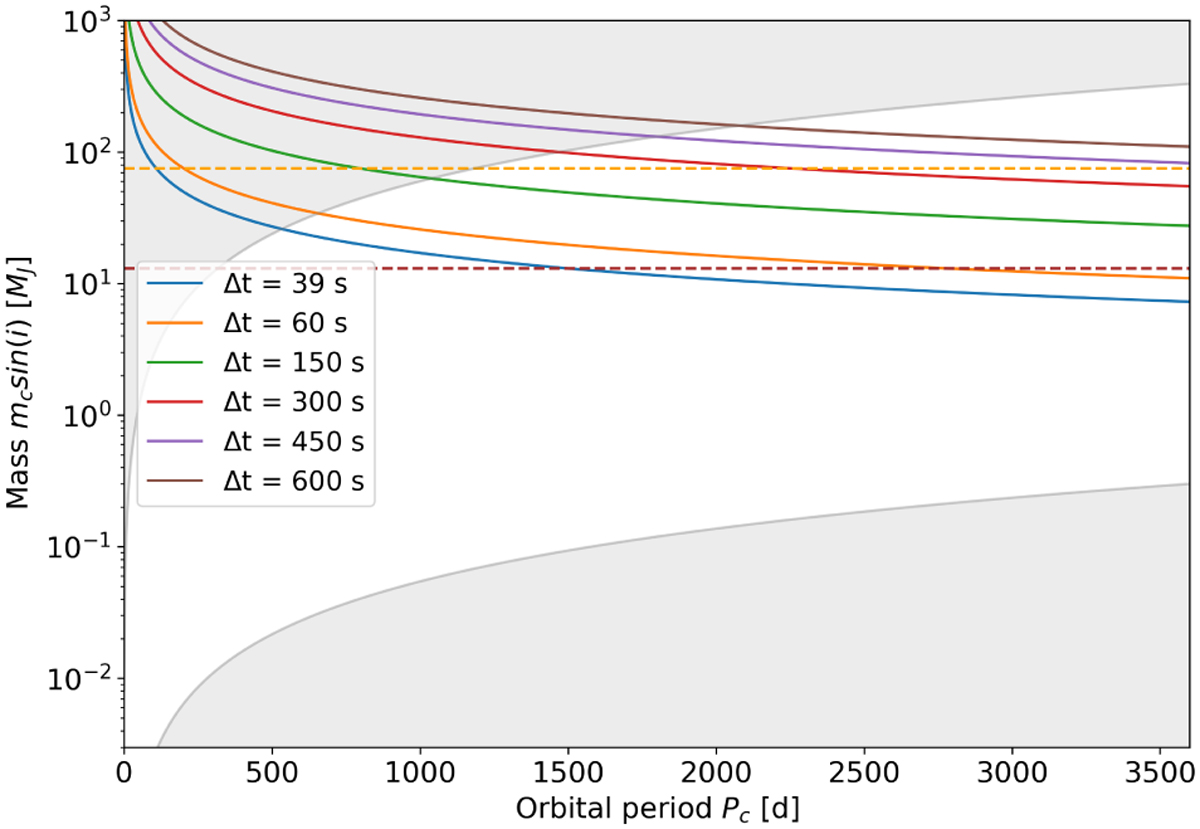
Fig. 14
Download original image
Results of the sensitivity analysis based on the light travel effect. The plot shows the relationship between the orbital period and the planetary mass of a planet responsible for 10, 25, 50, 75, and 100% of the TTVs. The lowest blue curve reflects the possibility that the periastron precession rate observed is caused solely by the Rømer effect (see text for more details). The yellow and brown horizontal lines represent the minimum stellar mass (≃75 MJ) and the minimum brown dwarf mass (≃13 MJ), respectively. The grey shaded regions represent the excluded area by RV analysis. The upper region indicates a hypothetical planet causing an RV amplitude greater than 125 m s−1. The lower region delineates the sensitivity threshold of 5 m s−1 (see text for more details).
Current usage metrics show cumulative count of Article Views (full-text article views including HTML views, PDF and ePub downloads, according to the available data) and Abstracts Views on Vision4Press platform.
Data correspond to usage on the plateform after 2015. The current usage metrics is available 48-96 hours after online publication and is updated daily on week days.
Initial download of the metrics may take a while.