Fig. 11
Download original image
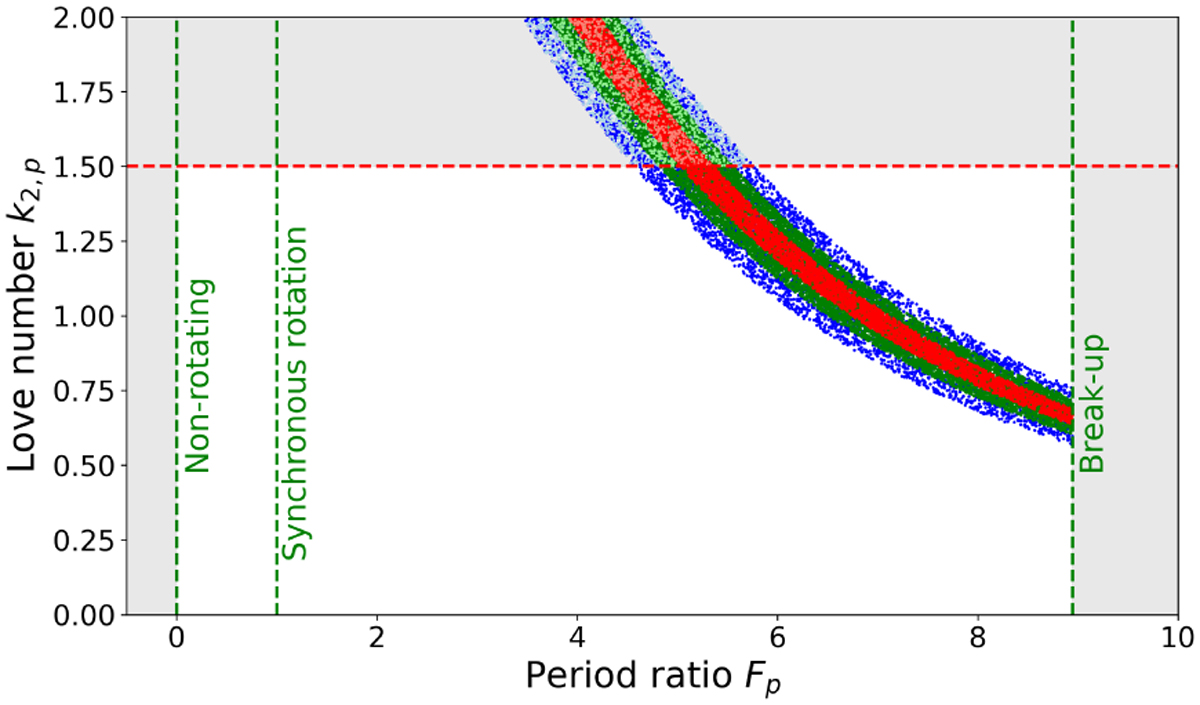
Couples of period ratio and Love number of the planet that solve Equations (8) and (9). The blue and light blue points correspond to a combination of (Fp, k2,p) that satisfies the observed periastron precession rate within its 1σ, 2σ, and 3σ error bars (red, green, and blue areas, respectively). The red horizontal line represents the physical limit where the body is homogeneous. From left to right, the three vertical lines highlight a non-rotation planet (Porb/Prot,p →0), synchronous rotation (Prot,p = Porb), and the break-up limit (Prot,p ≃ 8.95 Porb, corresponding to Prot,p ≃ 2.18 hours). The grey shaded regions are unphysical.
Current usage metrics show cumulative count of Article Views (full-text article views including HTML views, PDF and ePub downloads, according to the available data) and Abstracts Views on Vision4Press platform.
Data correspond to usage on the plateform after 2015. The current usage metrics is available 48-96 hours after online publication and is updated daily on week days.
Initial download of the metrics may take a while.