Fig. 10
Download original image
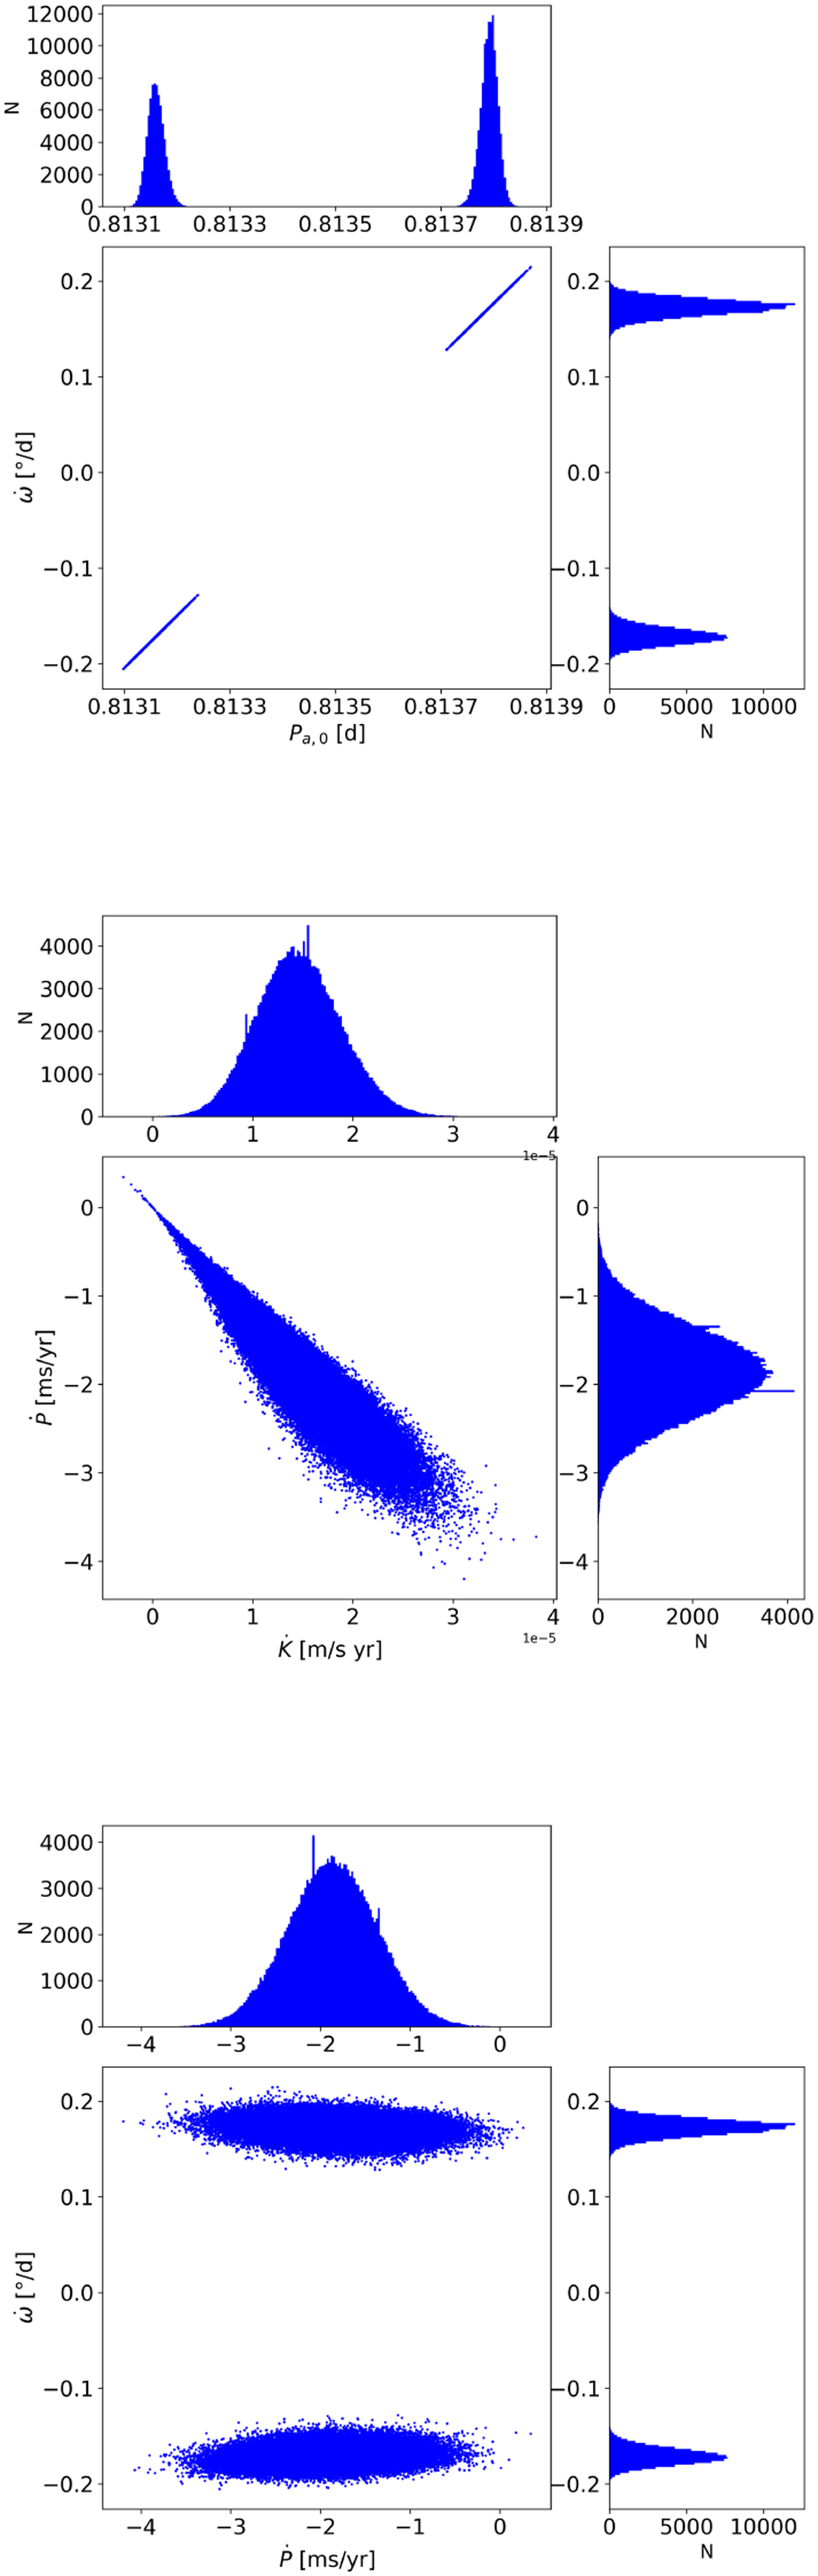
Posterior distribution of the parameters for all ten chains, excluding the DE-MCMC steps in the burn-in phase. Top plot: correlation between the anomalistic period and the periastron precession rate. A small number of chains were stuck in a local minimum with the same value as the detected ![]() value but with a negative sign. Due to the strong correlation between
value but with a negative sign. Due to the strong correlation between ![]() and Pa,0, the latter also shows a double-peaked posterior distribution. Middle plot: correlation between the tidal decay rate (Ṗa, a fitting parameter) and the change in the RV semi-amplitude
and Pa,0, the latter also shows a double-peaked posterior distribution. Middle plot: correlation between the tidal decay rate (Ṗa, a fitting parameter) and the change in the RV semi-amplitude ![]() , which is derived from its relation with the tidal decay rate Ṗa. The spikes in the posterior distributions denote the particularly investigated regions in the parameter space and the fact that their chains may become stuck in local minima before reaching the global minimum. Bottom plot: correlation between periastron precession rate and tidal decay rate showing that the two parameters are independent. The two opposite solutions of
, which is derived from its relation with the tidal decay rate Ṗa. The spikes in the posterior distributions denote the particularly investigated regions in the parameter space and the fact that their chains may become stuck in local minima before reaching the global minimum. Bottom plot: correlation between periastron precession rate and tidal decay rate showing that the two parameters are independent. The two opposite solutions of ![]() are visible.
are visible.
Current usage metrics show cumulative count of Article Views (full-text article views including HTML views, PDF and ePub downloads, according to the available data) and Abstracts Views on Vision4Press platform.
Data correspond to usage on the plateform after 2015. The current usage metrics is available 48-96 hours after online publication and is updated daily on week days.
Initial download of the metrics may take a while.