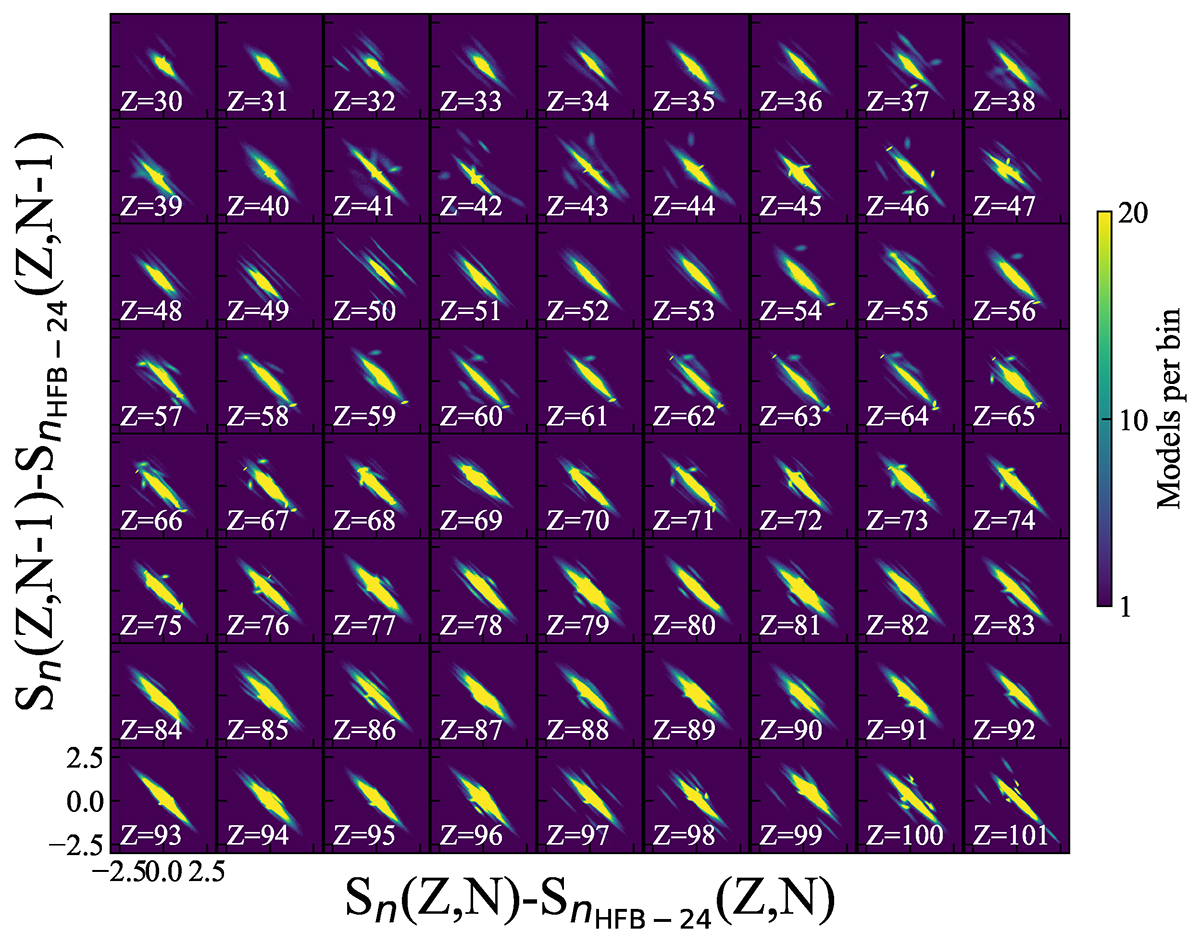
Fig. 5.
Download original image
Heat map representing the parameter uncertainty of Sn(Z, N − 1) (relative to HFB-24 values) as a function of Sn(Z, N) uncertainties (relative to HFB-24 values) for each BFMC combination selected in Case 2 (10643 combinations). The subplots use the same axis and are separated by isotopic chains to show the correlation for each of them. Each frame is 500 per 500 bins and each bin is color-coded to the number of combinations in it.
Current usage metrics show cumulative count of Article Views (full-text article views including HTML views, PDF and ePub downloads, according to the available data) and Abstracts Views on Vision4Press platform.
Data correspond to usage on the plateform after 2015. The current usage metrics is available 48-96 hours after online publication and is updated daily on week days.
Initial download of the metrics may take a while.