Fig. 5
Download original image
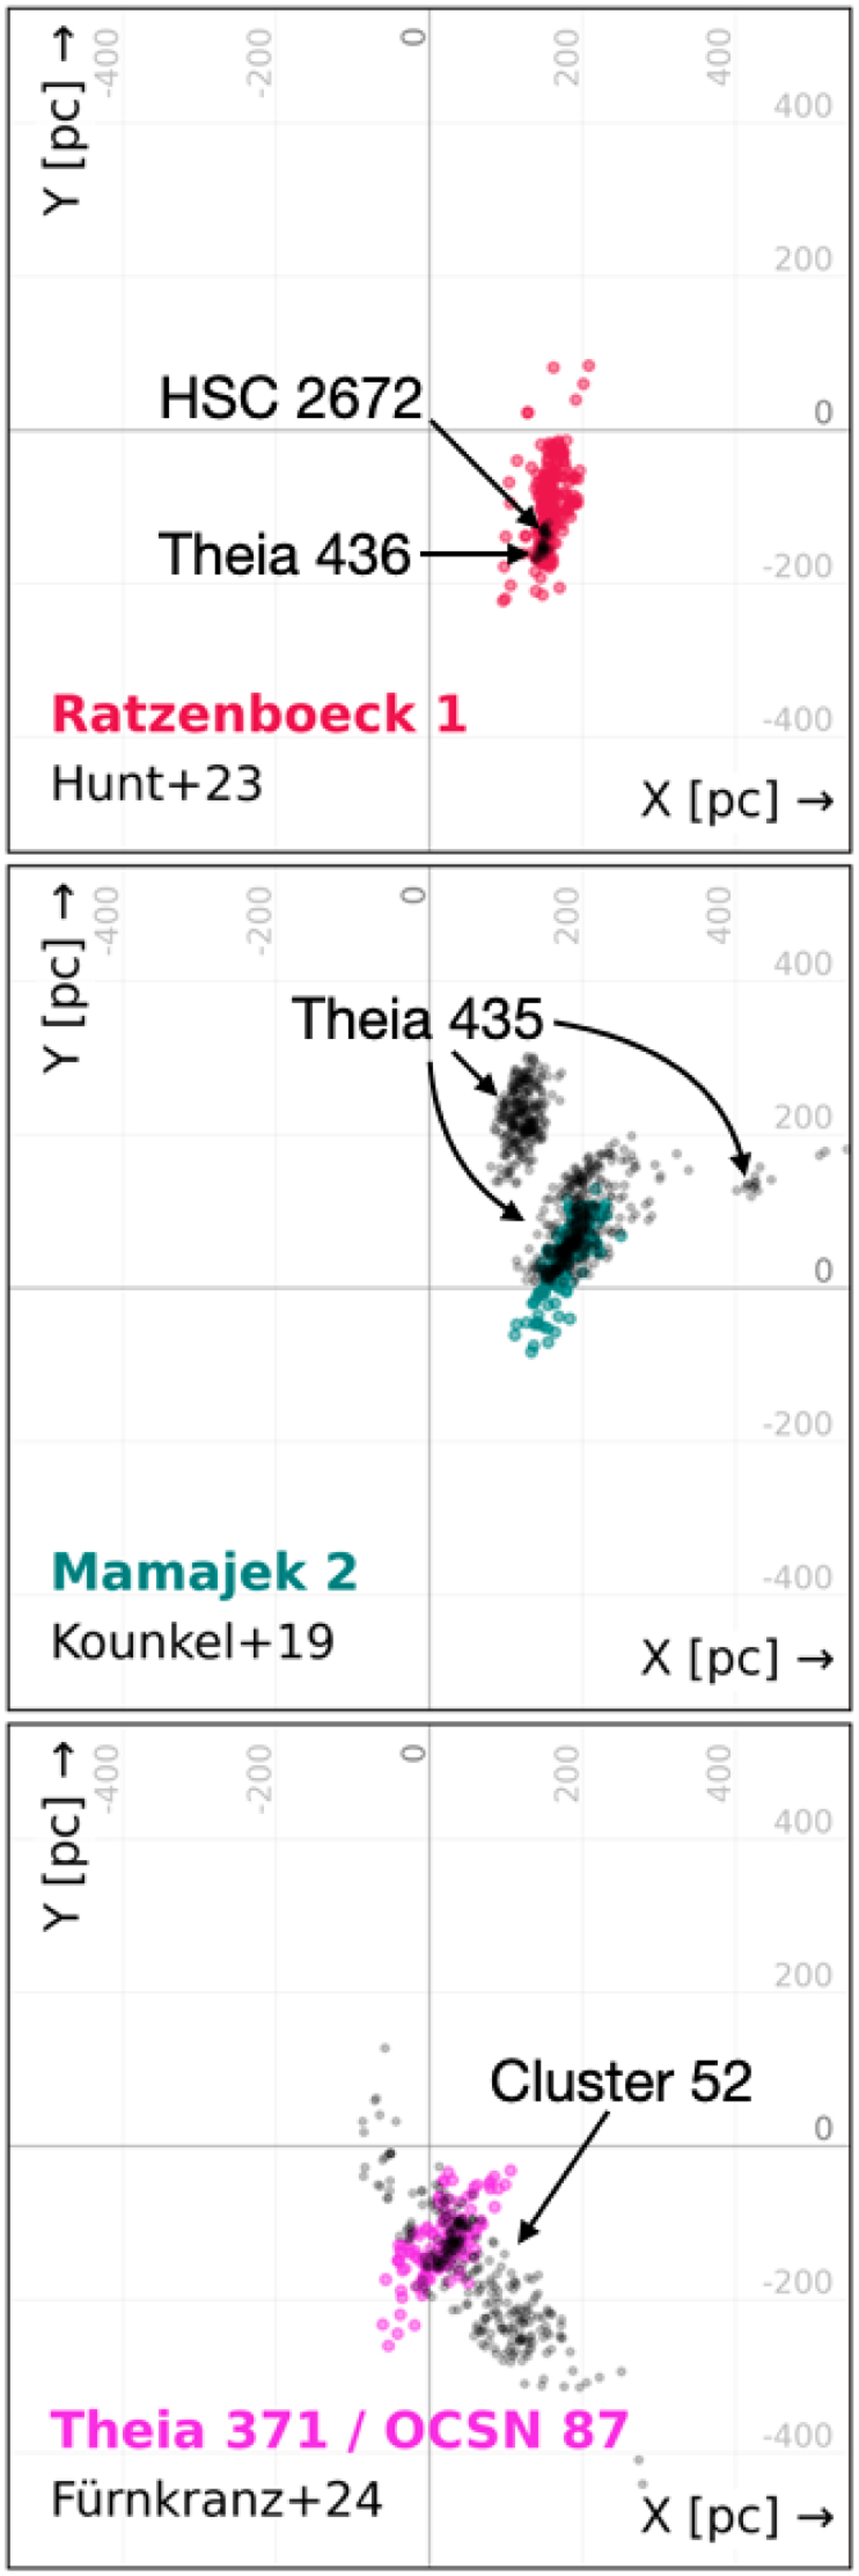
Examples of challenging cluster comparisons highlighted in the X-Y plane. The colored scatter points show the identified disk streams Ratzenboeck 1, Mamajek 2, and Theia 371/OCSN 87 (from top to bottom). The black scatter points show the crossmatch to a literature cluster in the HR23, KC19, and Fürnkranz et al. (2024) surveys (from top to bottom). See Sect. 4.6, Appendix C, and Table C.1 for further details.
Current usage metrics show cumulative count of Article Views (full-text article views including HTML views, PDF and ePub downloads, according to the available data) and Abstracts Views on Vision4Press platform.
Data correspond to usage on the plateform after 2015. The current usage metrics is available 48-96 hours after online publication and is updated daily on week days.
Initial download of the metrics may take a while.